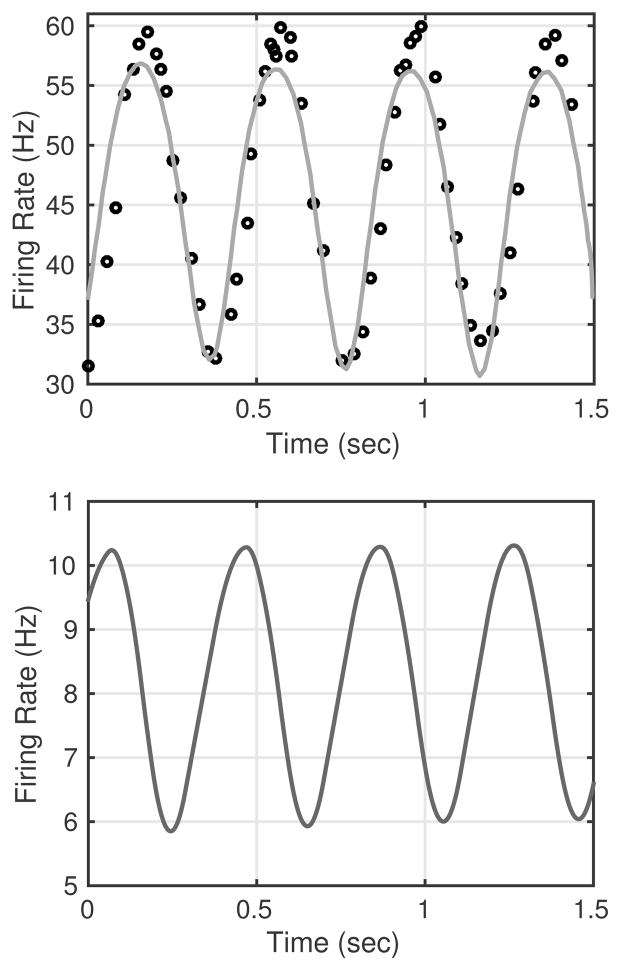
Fig. 12.
Firing rate response to a sinusoidal input (3) with amplitude pA = 12.5 mmHg, mean pb = 140 mmHg, frequency ω = 2.5 Hz, and phase shift ϕ = −0.1. The shape of the curve closely fits the experimental data reported by Franz et al. (1971) for A-type rabbit neurons, though the stimulus pb was adjusted to a higher level than that used to produce the experimental recordings. The resulting estimates of parameters are given in Table 1.

