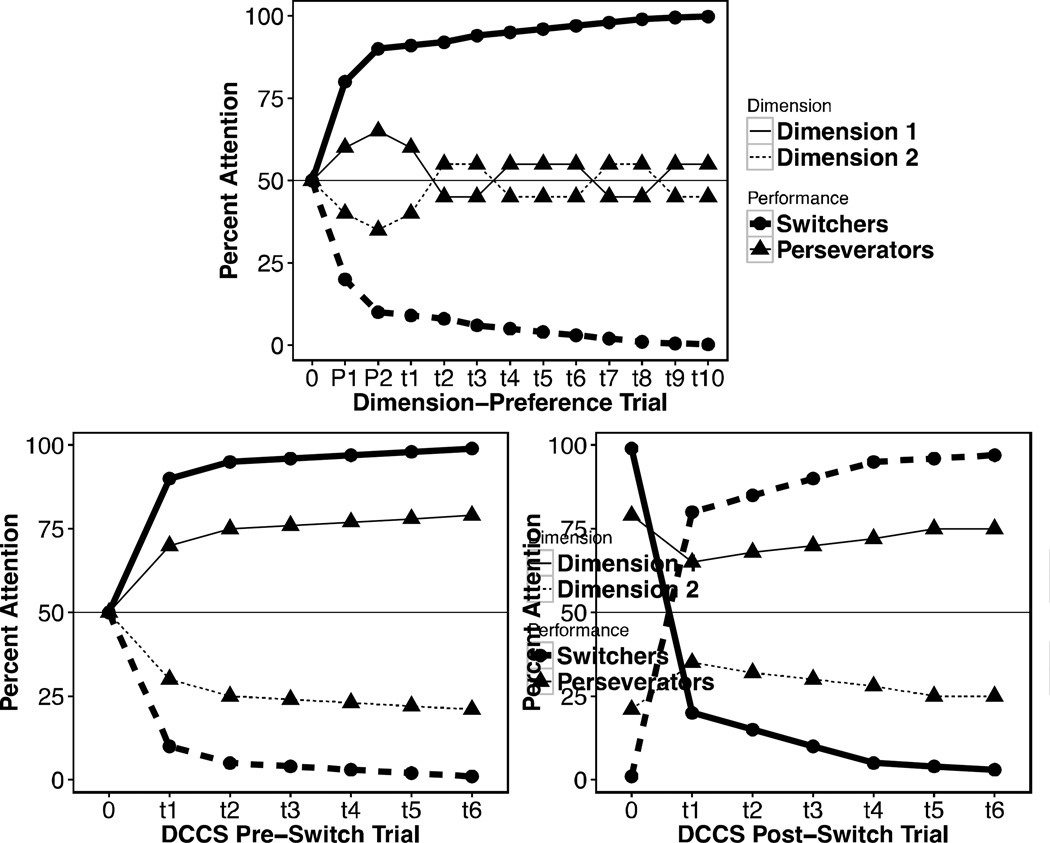
Figure 4.
A depiction of our theoretical account. For all figures, percent attention to Dimension 1 (solid lines) and Dimension 2 (dashed lines) are displayed for children who succeed at the Dimensional Change Card Sort (DCCS) Task (Switchers, circles) and those who fail at the DCCS task (Perseverators, triangles). Attention above threshold (50% attention) indicates that children respond according to that dimension. a) The distribution of attention for the Dimension-Preference (DP) task. Attention before the task is indicated by “0”, the priming trials are indicated by “P1” and “P2”, and “t1”– “t8” represent 8 out of the 10 trials during the DP task. b) The distribution of attention for the Pre-switch phase in the DCCS task. Time “0” is before the task, and “t1” – “t6” are 6 pre-switch trials in the DCCS task. c) The distribution of attention for the Post-switch phase in the DCCS task. Trial “0” indicates attention before the switching instructions are given. Trials “t1” – “t6” are 6 post-switch trials in the DCCS task.

