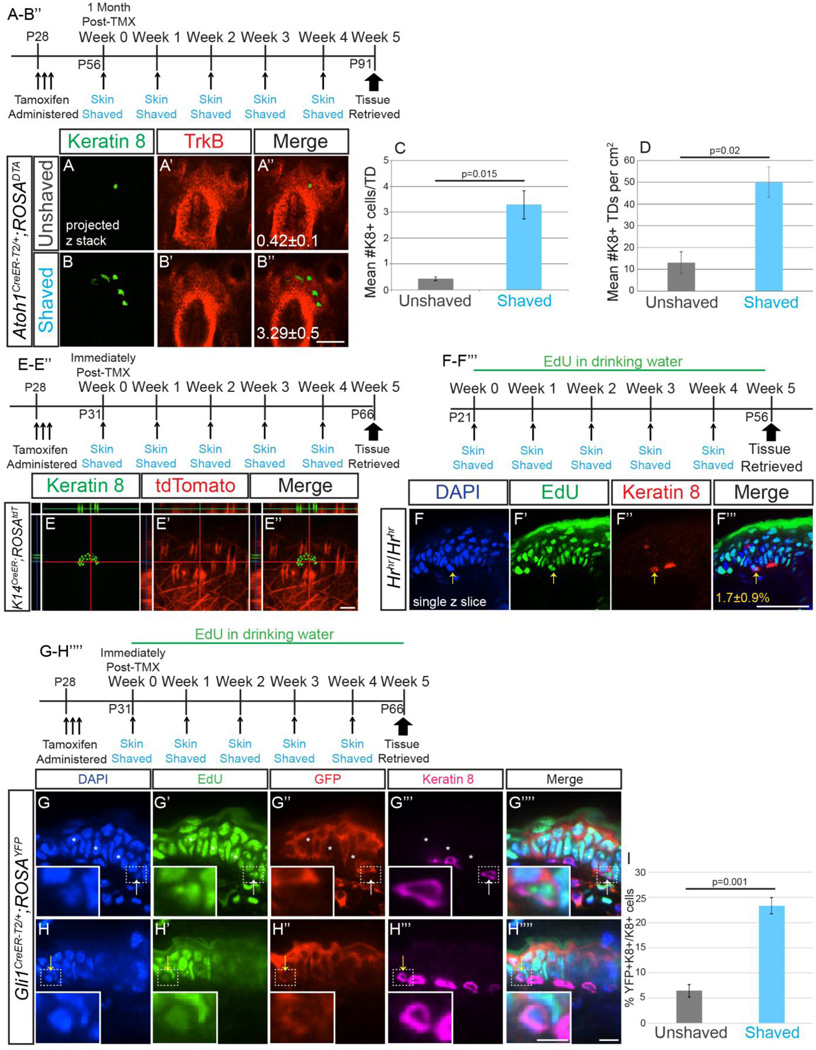
Figure 6. New Merkel cells are derived from Gli1+ touch dome keratinocytes, not Atoh1+, K14+ or hair follicle lineages, and production does not require existing Merkel cells.
(A–B’’) Confocal z-stack projections of wholemount back skin from tamoxifen-treated unshaved (A–A’’) or shaved once weekly (B–B’’) Atoh1CreER-T2/+; ROSADTA mice immunostained for K8 (A, B; green) and TrkB (A’, B’; red). Numbers of K8+ cells (A’’, B’’) are shown. (C) Average number of K8+ cells per touch dome in shaved and unshaved back and belly skin of mice (n=2–3 mice/condition) (D) Average number of touch domes containing at least 1 K8+ cell per 1cm2 of back and belly skin (n=2–3 mice/condition). (E–E’’) Single z-slice confocal image of wholemount back skin from tamoxifen-treated K14CreER; ROSAtdTomato mouse shaved once weekly immunostained for K8 (green, E) and imaged for endogenous tdTomato (red, E’). (F–F’’’) Single confocal z-slice of sectioned belly skin from a hairless Hrhr/Hrhr mouse given EdU in drinking water and shaved once weekly for five weeks. Yellow arrow indicates a K8+EdU+ cell. Percentage of K8+EdU+/K8+ cells±SEM (F’’’) are shown (n=3 mice/treatment). (G–H’’’’) Single confocal z-slice of sectioned belly skin from tamoxifen-treated Gli1CreER;ROSAYFP mice shaved once weekly visualized for EdU (green, G’, H’) and immunostained for YFP (red, G’’, H’’) and K8 (magenta, G’’’, H’’’). Insets are of K8+EdU+ cells that are YFP− (G–G’’’’, white arrow) and YFP+ (H–H’’’’, yellow arrow). Asterisks indicate YFP− touch dome keratinocytes. (I) Quantification of the percent of K8+YFP+/K8+ cells in unshaved and shaved GliCreER;ROSAYFP mice. Bars on graph are SEMs. Scale bars: A–F’’’ 50µm; G–H’’’’ 10 µm, insets 5 µm.

