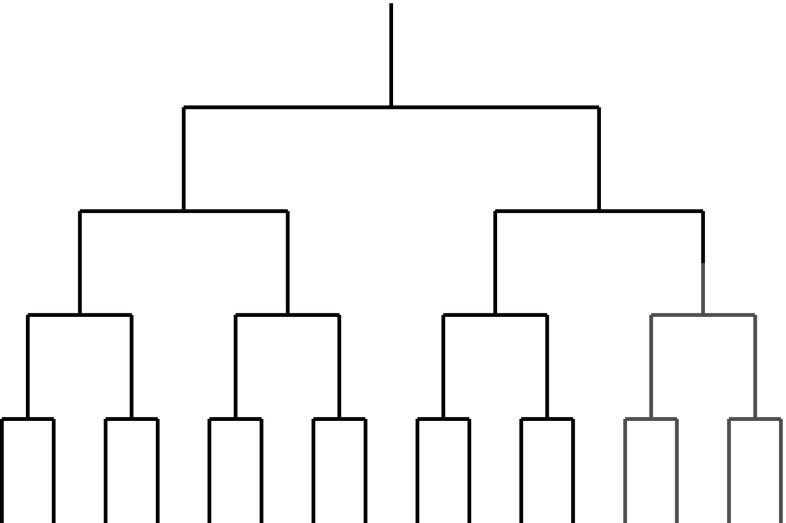
Fig. 1.
16 taxa. The branches with altered selective constraints are shown in red; the change in selection occurs at the midpoint of the branch connecting one quarter of the taxa to the rest of the tree. Data was simulated as described in Tamuri et al. (2012), with a fraction () of the sites in the protein evolving under different selective constraints in the two different parts of the tree. The connecting branch was labeled as the foreground branch in the branch-site analysis of PAML (Yang 2007) (Color figure online)

