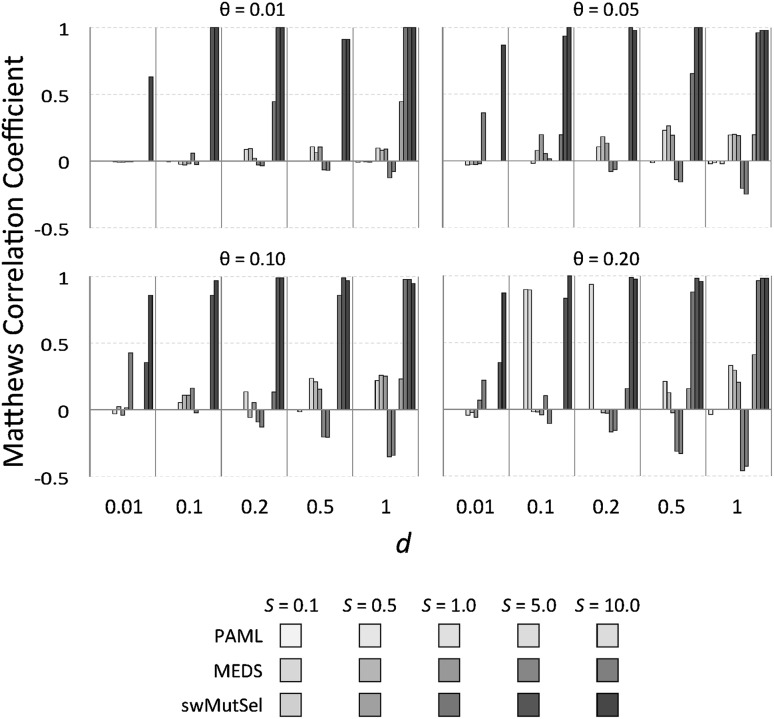
Fig. 5.
Comparative performance of PAML, MEDS and swMutSel on simulated data, as measured by the Matthews Coefficient (Matthews 1975). Colors and shades are as in Fig. 3. The Matthews correlation coefficient is equal to one for a perfect predictor and zero for a random predictor, while values less than zero indicates performance worse than random. The poor performance of MEDS is a result of the large false positive rate shown in Fig. 4 (Color figure online)

