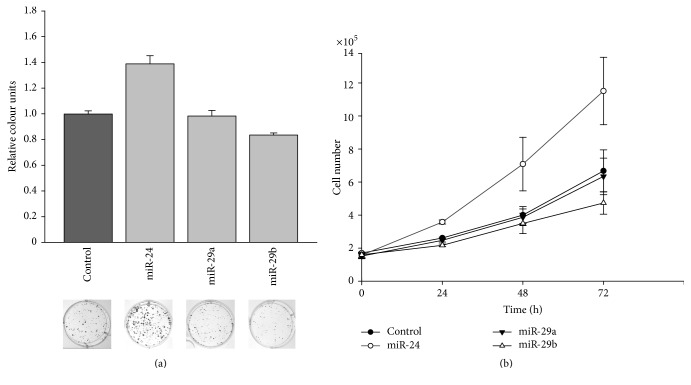
Figure 6.
Effect of miR-24 and miR-29a/b on cell growth. DU145 cells were transfected with miRNA expression vectors or control vectors and seeded in a limited cell number. Eight days after seeding, colonies were stained with crystal violet (a). Colony formation was quantified by densitometry analyses. Data show the mean and ± SEM of the densitometry analysis of CFA (p < 0.001) of three independent experiments. Cell growth was determined by automated cell counting of parallel experiments at 24, 48, and 72 h after transfection (b).

