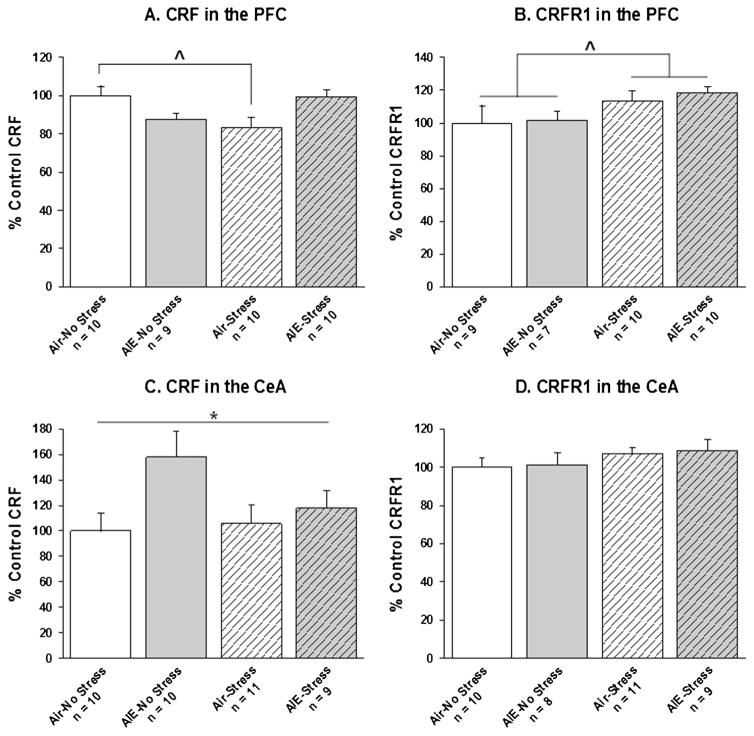
Fig. 3.
CRF and CRFR1 mRNA levels in the prefrontal cortex (PFC) and the central nucleus of the amygdala (CeA). Data are expressed as% control rats (i.e., air-no stress group). Caret denotes a significant difference between air-stress and air-no stress experimental groups (A: ^, p < 0.05) and a significant main effect of Stress exposure (B: ^, p < 0.05) in the ANOVA. Asterisk denotes a significant main effect of AIE exposure (C: *, p < 0.05).

