Fig. 5.
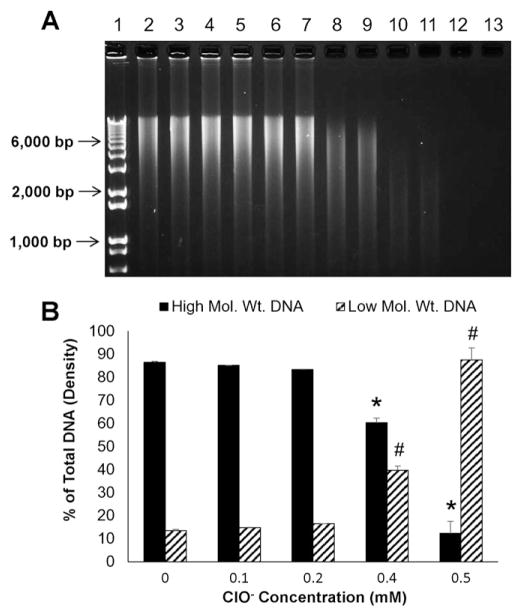
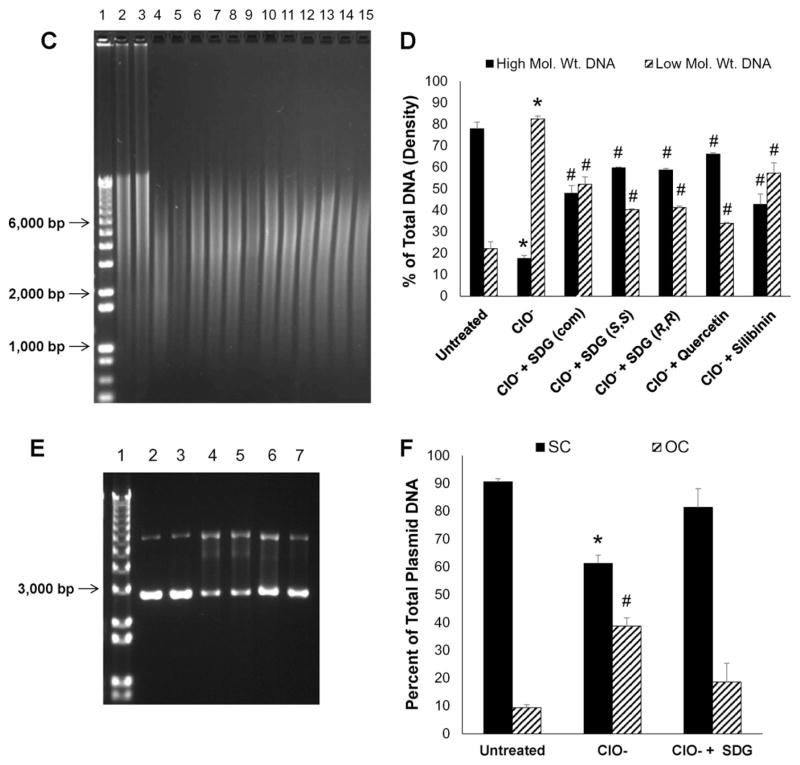
Hypochlorite-induced calf thymus DNA damage Panels 5A and 5C show representative agarose gel scans of calf thymus DNA following exposure to HOCl. Panels 5B and 5D show high and low molecular weight DNA fragments as percent of total DNA. Panels 5E and 5F show the effect of SDG on hypochlorite-induced damage to plasmid DNA. Panel 5E shows a representative agarose gel of plasmid DNA after exposure to HOCl. Panel 5F shows SC and OC forms presented as percent of total plasmid DNA. For Panel 5A, lane 1 — 1 kb DNA standard ladder, lanes 2 and 3 — untreated DNA, lanes 4 and 5 — 0.1 mM ClO−, lanes 6 and 7 — 0.2 mM ClO−, lanes 8 and 9 — 0.4 mM ClO−, lanes 10 and 11 — 0.5 mM ClO− and lanes 12 and 13 — 0.6 mM ClO−. * indicates a statistically significant difference (p < 0.05) in high molecular weight DNA as compared to untreated control and # indicates a statistically significant difference (p < 0.05) in low molecular weight DNA as compared to untreated control. For Panel 5C, Lane 1 — 1 kb DNA standard ladder, lanes 2 and 3 —untreated DNA, lanes 4 and 0.5 mM ClO−, lanes 6 and 7 — 0.5 mM ClO− + SDG (com) 1 μM, lanes 8 and 9 — 0.5 mM ClO− + SDG (S,S) 1 μM, lanes 10–11 — 0.5 mM ClO− + SDG (R,R) 1 μM, lanes 12–13 — 0.5 mM ClO− + quercetin 1 μM and lanes 14 and 15 — 0.5 mM ClO− + silibinin 1 μM. * indicates a statistically significant difference (p < 0.05) in high and low molecular weight DNA as compared to untreated control and # indicates a statistically significant difference (p < 0.05) in high and low molecular weight DNA as compared to 0.5 mM ClO−. For Panel 5E, Lane 1 — 1 kb DNA standard ladder, lanes 2 and 3 — untreated plasmid DNA, lanes 4 and 5 — 4.5 mM ClO−, lanes 6 and 7 — 4.5 mM ClO− + SDG 25 μM. The data are presented as mean + SEM. * indicates a statistically significant difference (p < 0.05) in SC DNA as compared to untreated control and # indicates a statistically significant difference (p < 0.05) in OC DNA as compared to untreated control.


