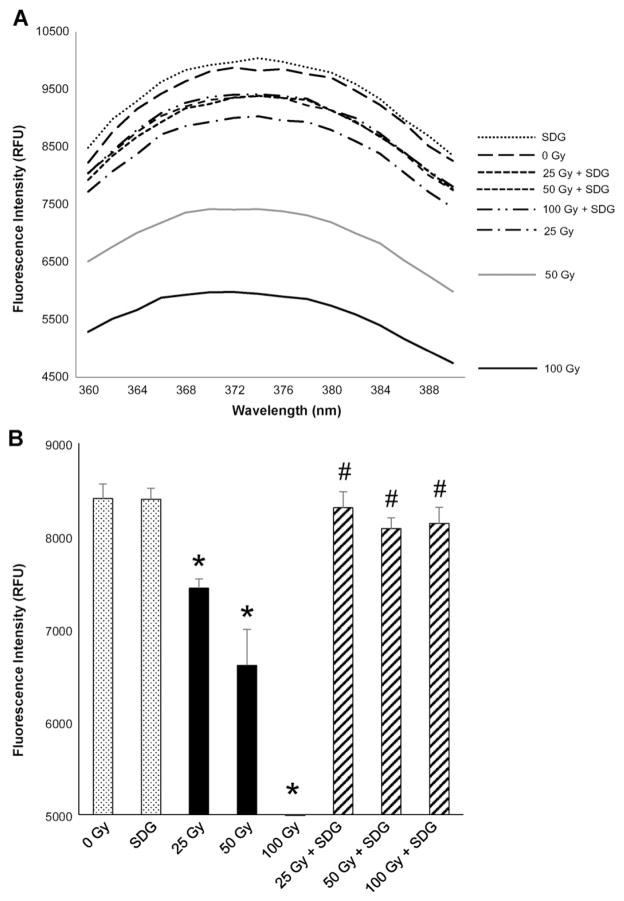
Fig. 7.
SDG prevents γ-radiation-induced modification of 2-aminopurine (2-AP) Panel 7A shows the representative spectra for all the treatment conditions. Panel 7B shows the fluorescence at 374 nm (emission maximum). For each condition, all samples were evaluated in duplicate. The data are presented as mean + standard error. * indicates a statistically significant difference (p < 0.05) in fluorescence intensity as compared to the 0 Gy treatment condition (control) and # indicates a statistically significant difference (p < 0.05) in fluorescence intensity as compared to each respective radiation dose treatment condition.

