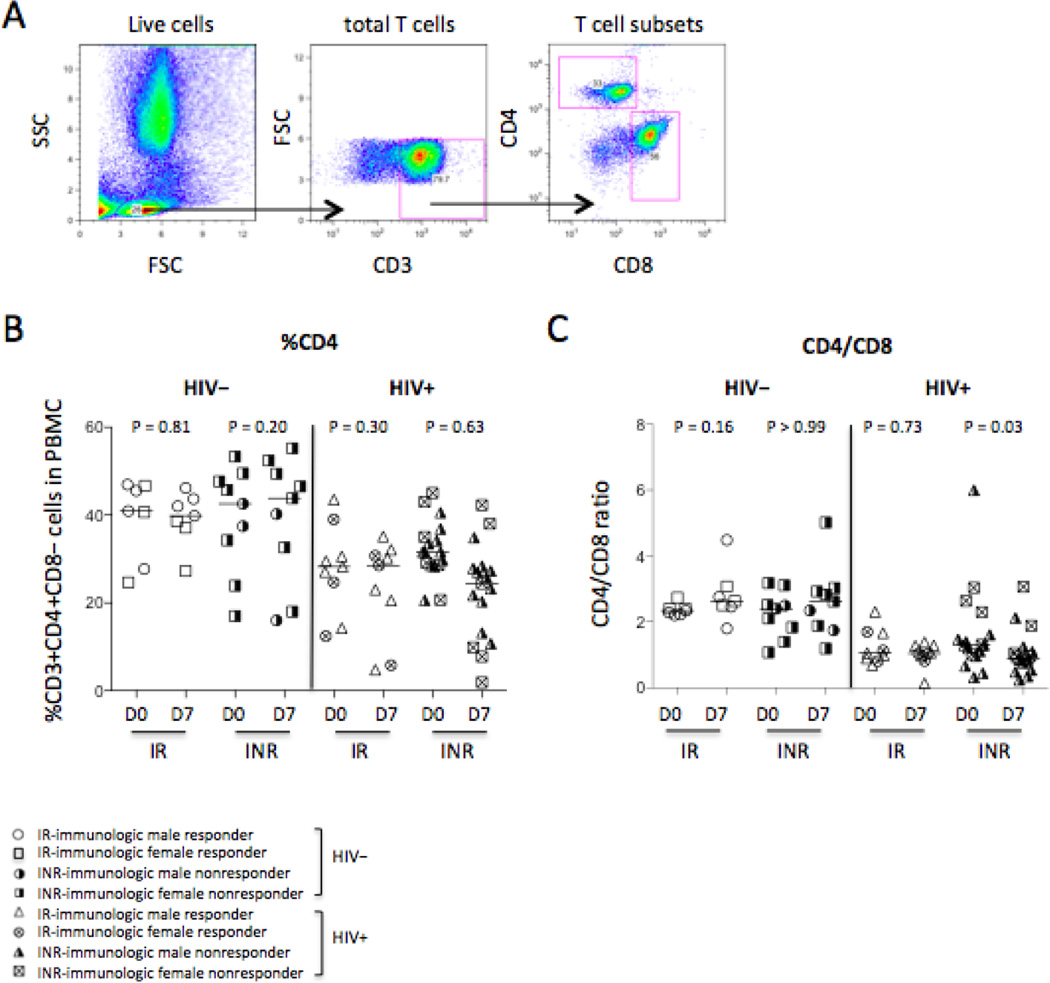
Figure 3.
CD4+ T cell distribution. (A) Representative dot plots display the gating strategy used to assess the percentages of CD3+CD4+CD8− T cells in PBMCs and the ratio of CD4+ T cells versus CD8+ T cells. (B) The median frequency of CD3+CD4+CD8− T cells in PBMCs. (C) The median ratio of CD4+ T cells versus CD8+ T cells.

