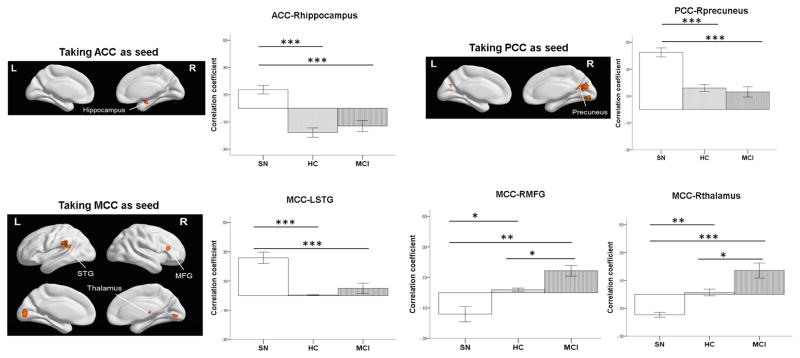
Figure 2. Group Differences in FC When Taking the Cingulate Cortex Regions as the Seeds.
SN = supernormal; HC = healthy control; MCI = mild cognitive impairment; ACC = anterior cingulate cortex; PCC = posterior cingulate cortex; MCC = middle cingulate cortex; STG = superior temporal gyrus; MFG = middle frontal gyrus. * p< .05; ** p< .01; *** p < .001. Education was controlled in the comparison.

