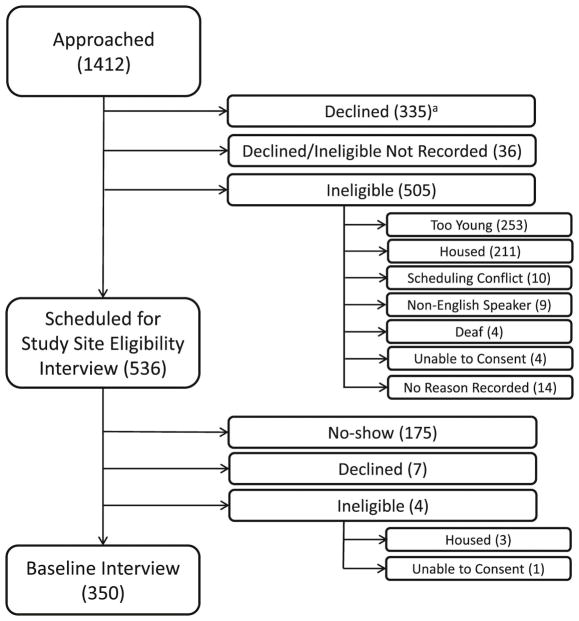
Figure 1.
Flow-chart of Recruitment of 350 Older Homeless Adultsa
aThis figure shows the number of individuals approached, assessed for eligibility, and enrolled in the study, noting specific reasons for inability to enroll. Values represent the number of individuals in each group.
bParticipants who declined after being approached (335) were not assessed for eligibility. Therefore, the number of participants who were ineligible for the study may have been higher than the numbers presented in this figure.

