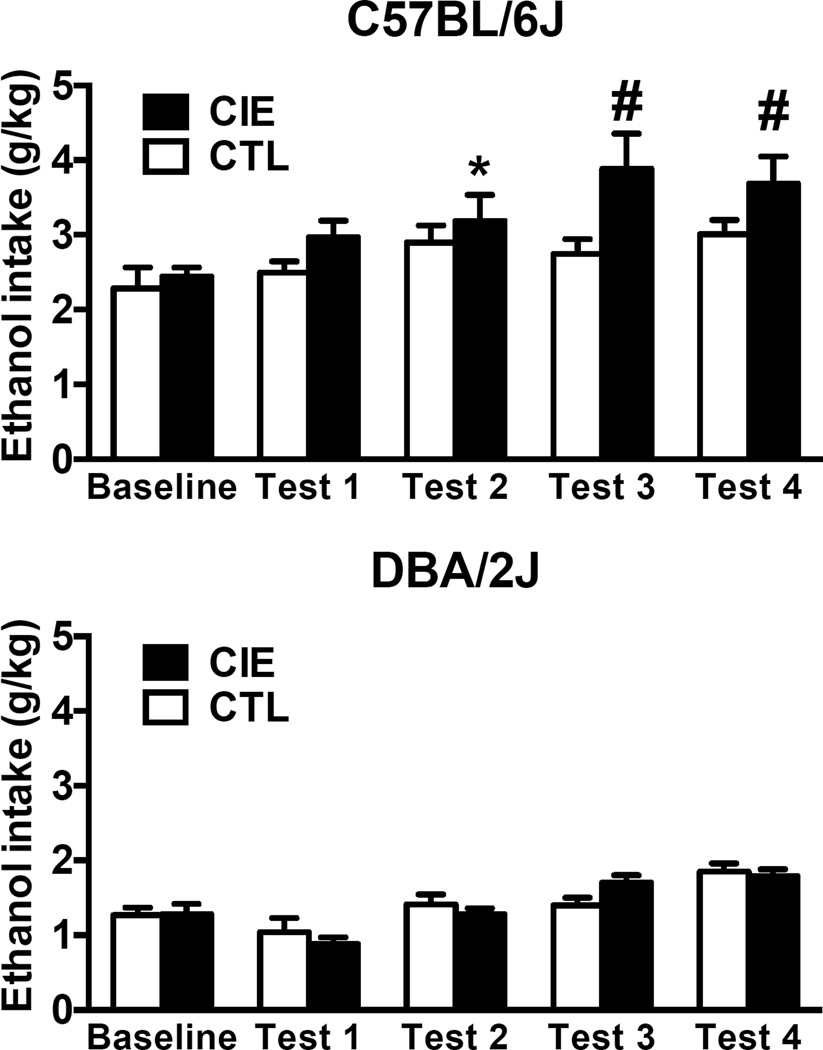
Figure 2.
Ethanol intake (g/kg) for male C57BL/6J (top) and DBA/2J mice averaged over the last 5 days of baseline and the five days of ethanol intake test cycles 1–4. * indicates higher intake compared to baseline; # indicates higher intake compared to baseline and CTL group in the same test cycle. Values are mean ± SEM.

