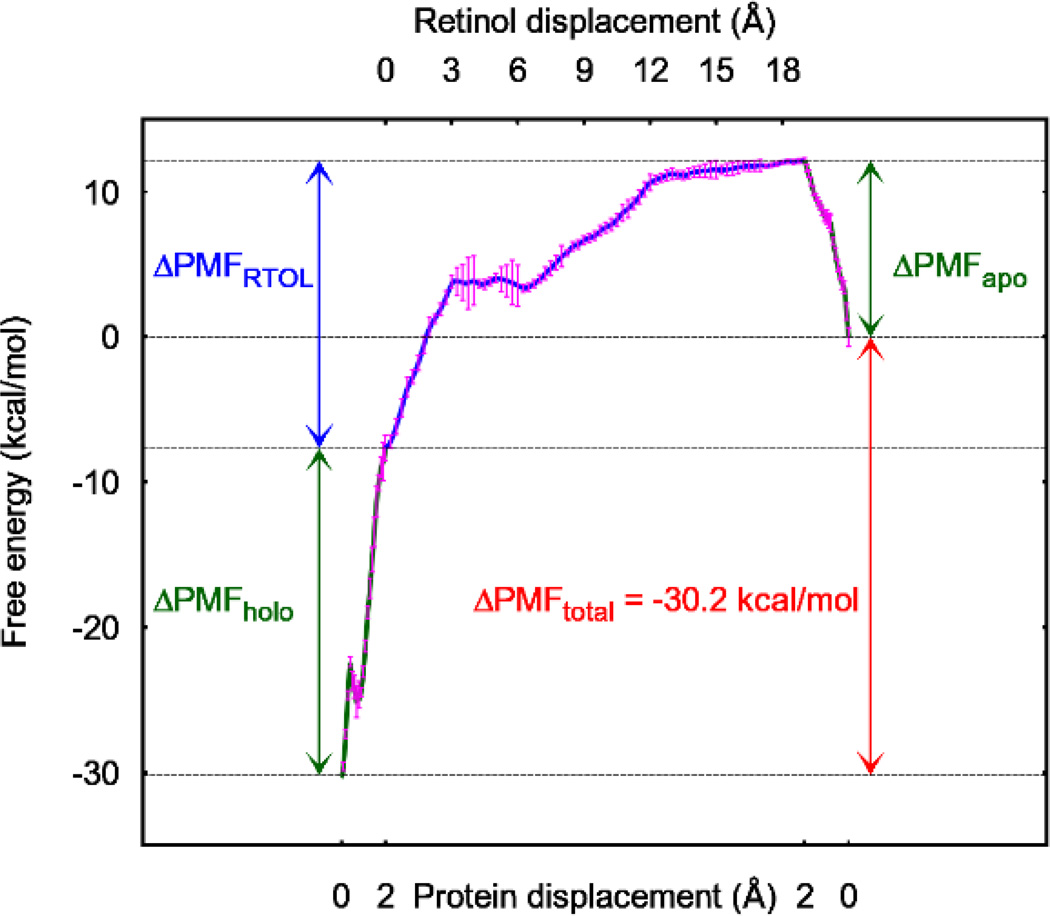
Fig. 3.
PMF curves along the path to open the holo protein up, to pull retinol out, and to close (reversely open) the apo protein back. The protein displacements are those of pulling centers 1 and 2 (Table I) on helix II of CRBP1. The error bars are most pronounced near the RTOL displacement of 4, which is taken as the error bar for our final result in Gibbs free energy of binding (Table II). The error bars represent the standard deviations from the work measurements along the four pulling paths for each section (shown in Figs. S14 to S16 of the SI).

