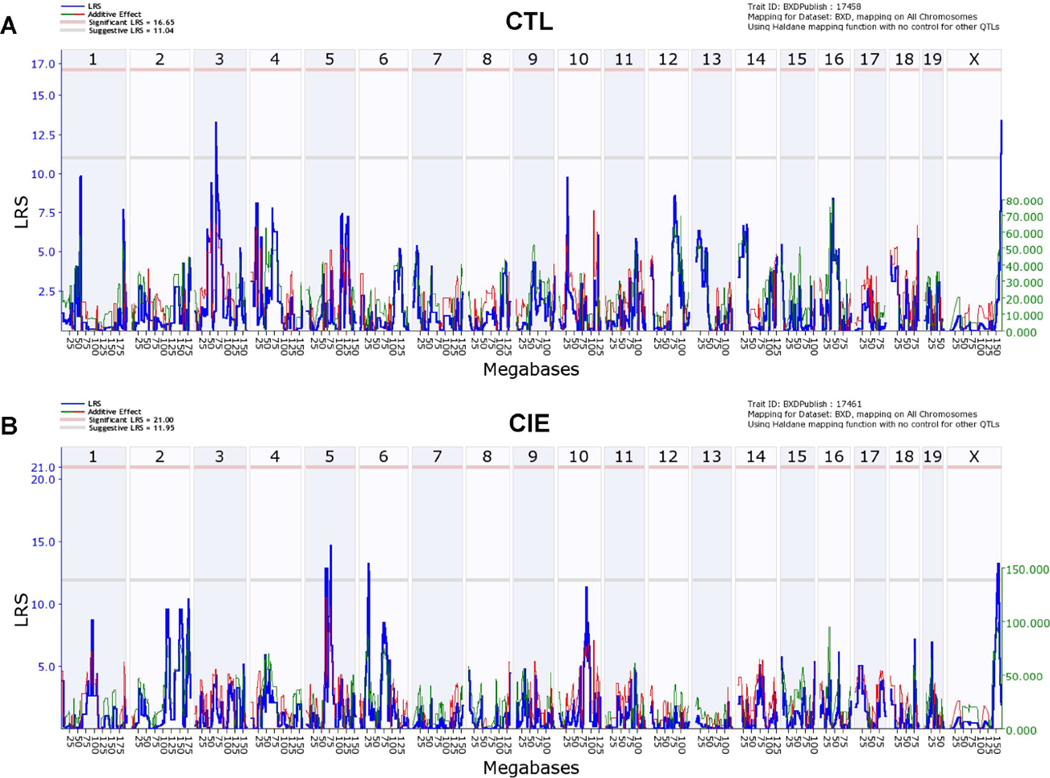
Fig. 2. Genome-wide interval mapping plots for basal pregnenolone levels across BXD strains.
Mice from each genotype received four cycles of chronic intermittent ethanol (CIE) vapor exposure (CIE group) or air exposure (CTL group) (16 h/day × 4 days, followed by 72-h withdrawal), alternated with 5-day drinking test cycles using a two-bottle (15% v/v ethanol vs. water) limited access (2 h/day) drinking model. Blood samples for pregnenolone assay were collected 72 h after a fifth CIE or air exposure cycle. (A) Likelihood ratio statistic (LRS) scores for pregnenolone levels in all CTL cases (GeneNetwork BXD phenotype ID 17458) across the entire genome show suggestive QTLs on chromosomes 3 and X (LRS of 14 for both). (B) LRS scores for pregnenolone levels in all CIE cases (GeneNetwork BXD phenotype ID 17461) across the entire genome show suggestive QTLs on chromosomes 5 (LRS of 15), 6 (LRS of 13), and X (LRS of 13). The y-axis and the thick blue lines provide the LRS of the association between the trait and the genotypes of markers. The two horizontal lines are the suggestive (gray) and significance (red) thresholds computed using 5000 permutations. A positive additive coefficient (green line) indicates that D alleles increase trait values. A negative additive coefficient (red line) indicates that B alleles increase trait values.

