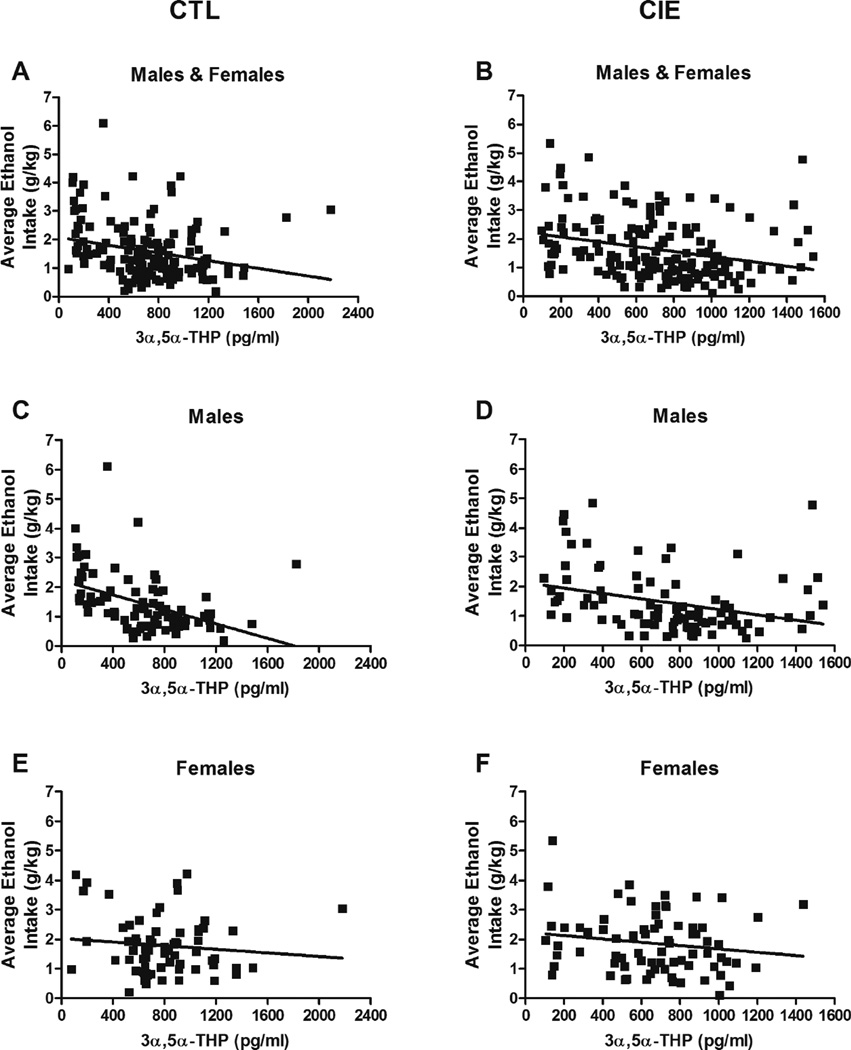
Fig. 4. Correlations between 3α,5α-THP levels and ethanol intake in individual BXD strains.
Mice from each genotype received four cycles of chronic intermittent ethanol (CIE) vapor exposure (CIE group) or air exposure (CTL group) (16 h/day × 4 days, followed by 72-h withdrawal), alternated with 5-day drinking test cycles using a two-bottle (15% v/v ethanol vs. water) limited access (2 h/day) drinking model. Blood samples for 3α,5α-THP assay were collected 72 h after a fifth CIE or air exposure cycle. 3α,5α-THP levels are expressed as pg/mL and are reported for each individual mouse. Average ethanol intake (g/kg) refers to ethanol intake during Test 4 of the two-bottle choice test and is reported for each mouse. (A) Spearman r = –0.26, p = 0.001, n = 152. (B) Spearman r = –0.32, p < 0.0001, n = 167. (C) Spearman r = – 0.51, p < 0.0001, n = 85. (D) Spearman r = –0.38, p = 0.0001, n = 93. (E) Spearman r = –0.06, p = 0.61, n = 67. (F) Spearman r = –0.15, p = 0.19, n = 74.

