
Fig. 2.
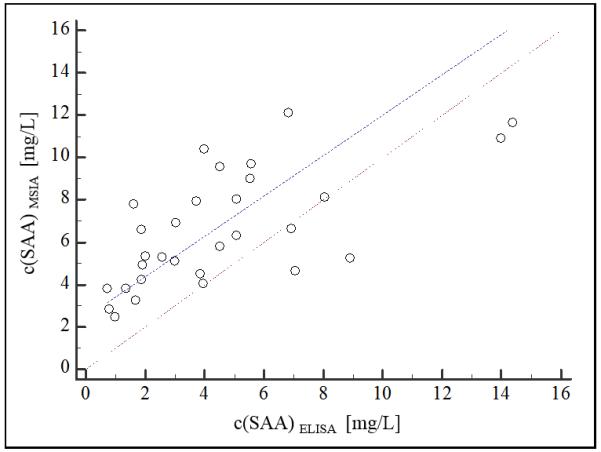
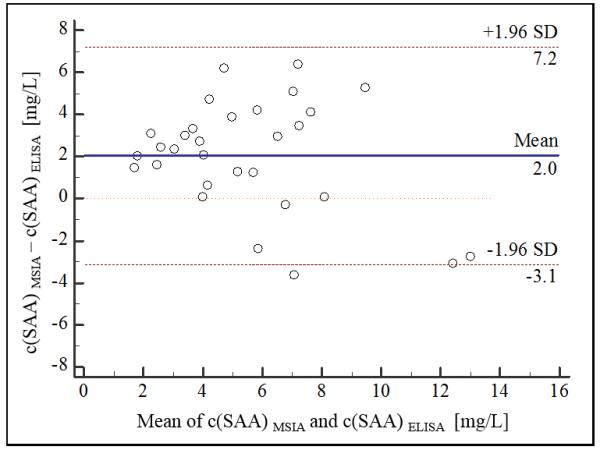
SAA method validation MSIA vs ELISA a) scatter plot (dashed line represents the obtained regression; dotted line represents identity (x=y); b) Bland-Altman difference plot (solid line represents the mean of concentration difference, 2 mg/L; dashed lines represent limits of agreement ±1.96 SD).