
Fig. 4.
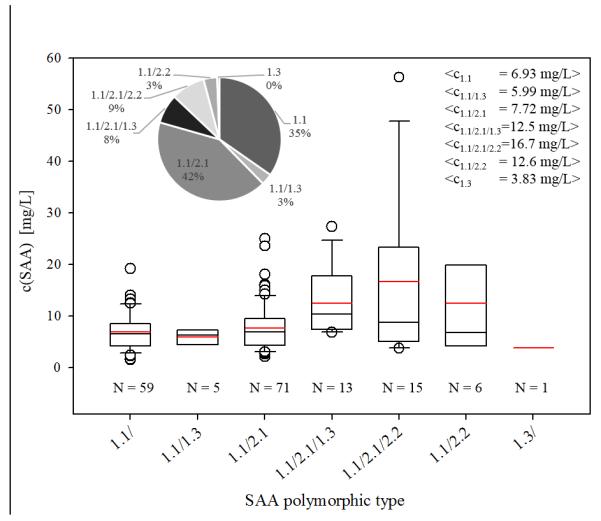
Total SAA concentration distribution among different SAA polymorphic profiles identified in the sample cohort; * The inlets present the percentage distribution of the SAA polymorphic profiles (left) and the total average SAA concentration in each sample subset (right).