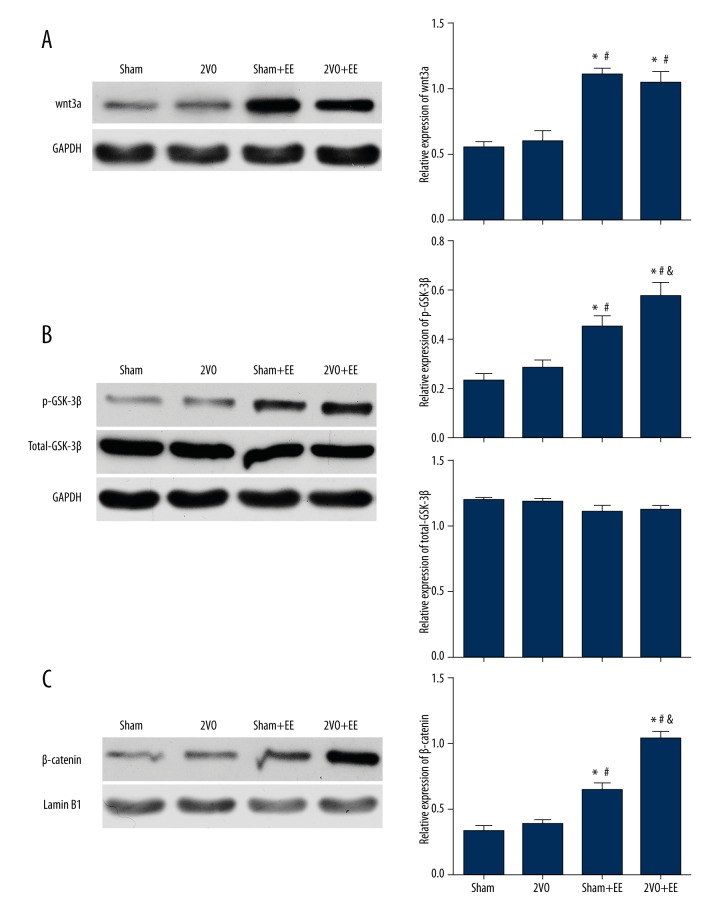
Figure 4.
Effects of EE on the expression of wnt3a,GSK-3β and β-catenin. (A) Representative protein bands of wnt3a from Western blot and quantifications of band densities (means ±SEM) are expressed as densitometric ratios of wnt3a to GAPDH. (B) Representative protein bands of p-GSK-3β and total-GSK-3β from Western blot, quantifications of band densities (means ±SEM) are expressed as densitometric ratios of p-GSK-3β to total-GSK-3β, and quantifications of band densities (means ±SEM) are expressed as densitometric ratios of total-GSK-3β to GAPDH. (C) Representative protein bands of β-catenin from Western blot and quantifications of band densities (Means±SEM) are expressed as densitometric ratios of β-catenin to Lamin B1. * p<0.05 versus sham rats, # p<0.05 versus 2VO rats, & p<0.05 versus sham+EE rats. Data are expressed as mean ±SEM, n=5/group. 2VO – bilateral common carotid occlusion; EE – environmental enrichment.

