
FIGURE 3.
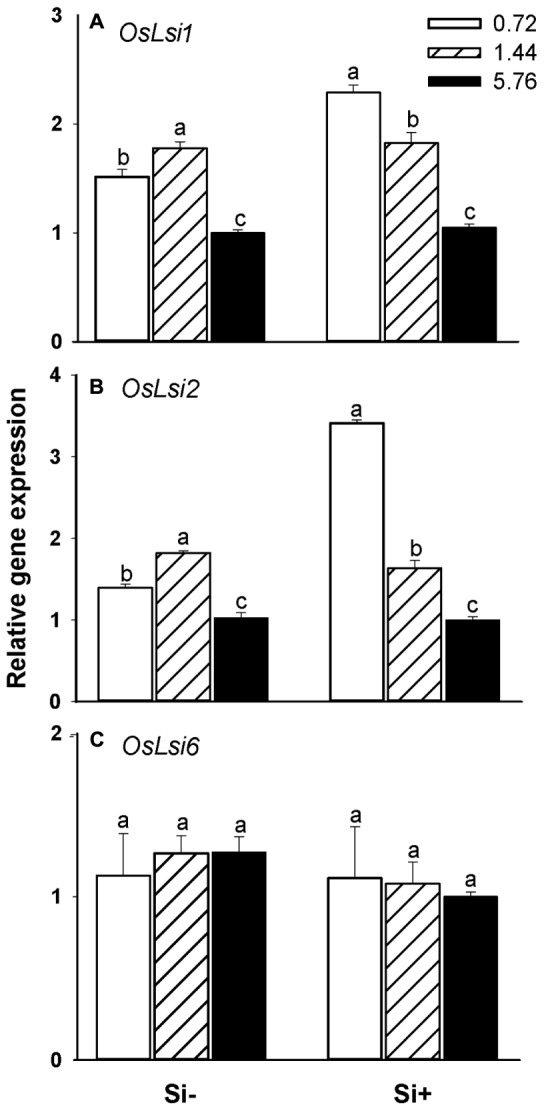
Effects of different N fertilization levels on the relative expression of genes (A) OsLsi1, (B) OsLsi2, and (C) OsLsi6 involved in Si uptake and translocation in rice plants. Values are mean ± SE (n = 3). Letters above bars indicate significant differences among treatments (Tukey’s multiple range test, P < 0.05).