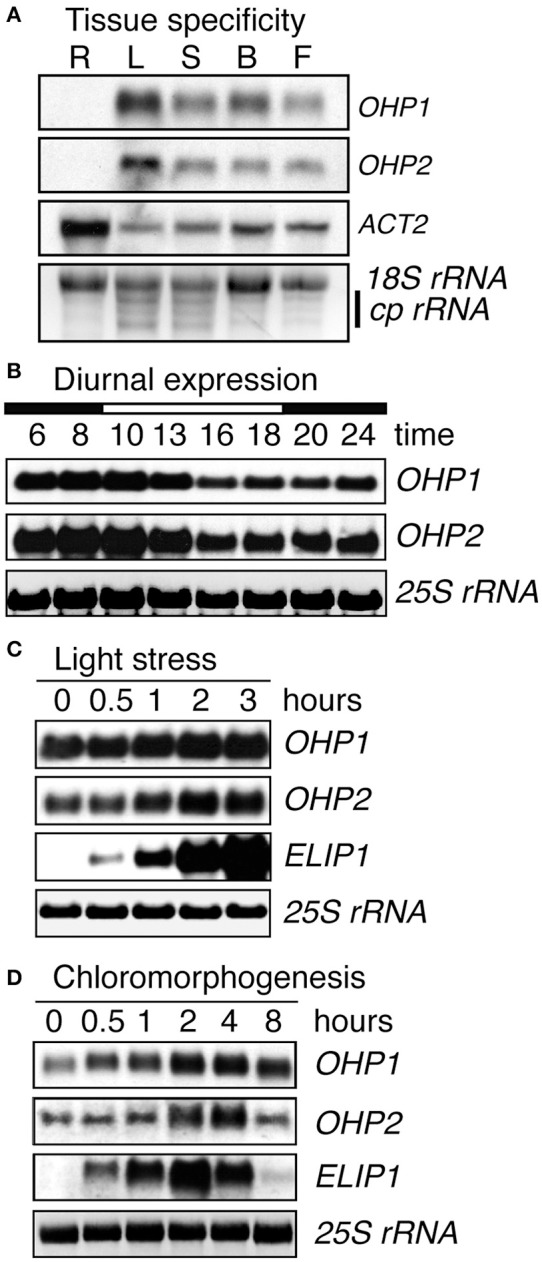
Figure 2.

Light regulation of OHP1 and OHP2 expression. Transcript levels of OHP1, OHP2, ELIP1, and ACT2a in Col-0 (WT) plants were analyzed by northern blotting. (A) Different organs from mature plants in the reproductive phase were analyzed separately. R, Roots; L, Leaves; S, Stems; B, Buds; F, Flowers. Detection of ACT2 demonstrates the successful isolation of mRNA from roots. EtBR-stained 18S rRNA and chloroplast rRNAs (cp rRNA) are shown as loading control. (B) Diurnal regulation of OHP1 and OHP2 transcript levels in mature leaves of 6-week-old WT plants cultivated in an 8 h light/16 h dark cycle at a light intensity of 120 μmol photons m−2 s−1. The light period (10 a.m. to 6 p.m.) is indicated as a white bar on top of the time scale. (C) Light stress was induced by exposing detached leaves of plants cultivated at 120 μmol photons m−2 s−1 to a light intensity of 1000 μmol photons m−2 s−1. Induction of ELIP1 expression served as a control to demonstrate the presence of light stress. (D) De-etiolation was induced by exposing 2-week-old, dark-grown WT seedlings to white light at an intensity of 100 μmol photons m−2 s−1. Again, expression of ELIP1 served as a control to monitor the progression of de-etiolation. In (B–D), EtBR-stained 25S rRNA serves as loading control.
