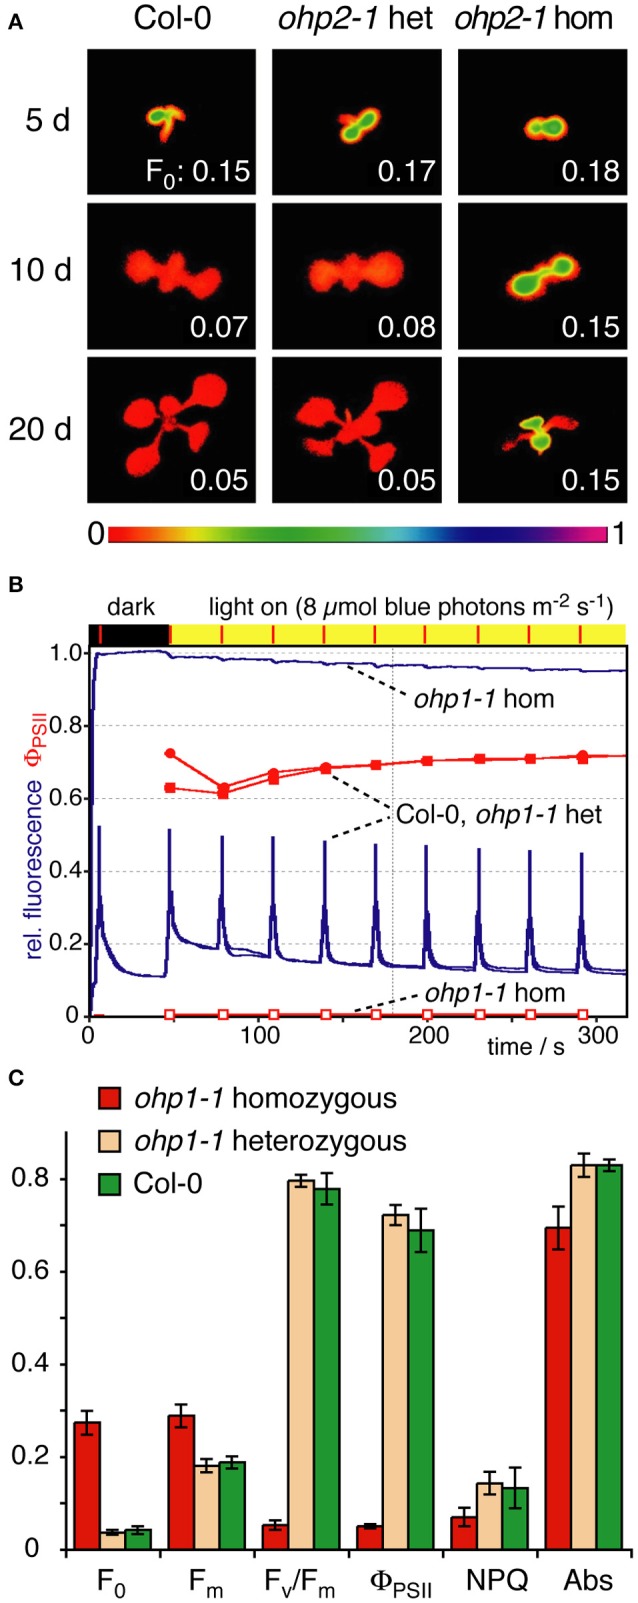
Figure 5.

Photosynthetic performance of ohp1 and ohp2 mutants. (A) F0 images of WT plants, heterozygous and homozygous ohp2 mutants were recorded 5, 10, and 20 d after germination. Plants were grown in a 12 h light/12 h dark cycle at a light intensity of 10 μmol photons m−2 s−1 at 18°C. The bar below represents the color to numeric value conversion. The F0 values indicated in the panels are the average over the area of one cotyledon (5 and 10 d after germination) or a true leaf (at 20 d). (B) Fluorescence traces (blue lines) of an induction kinetic using mature true leaves of 3-week-old homozygous and heterozygous ohp1 mutants as well as WT plants. The plants were exposed to blue actinic illumination of 8 μmol photons m−2 s−1, which is corresponding to the cultivation conditions with 15 μmol photons m−2 s−1 white light. The operating efficiency of PSII (ΦPSII) is shown in red. (C) Fluorescence-derived photosynthetic parameters of mature leaves analyzed as described above. F0, Minimal fluorescence of dark-adapted leaves; Fm, Maximal fluorescence of dark-adapted leaves; Fv/Fm, Maximal photochemical efficiency of dark-adapted leaves; NPQ, Non-photochemical quenching; Abs, Relative absorptivity of the leaves. Values are mean±SD (N = 5). Homozygous mutants differed significantly from WT and heterozygous plants in all analyzed parameters (Student's t-test, p < 0.05).
