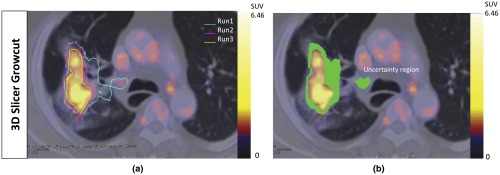
Fig. 3.
A representative example of the uncertainty volume observed with the 3D Slicer GrowCut method. (a) The lesion was delineated in three separate runs. There was variability with each run and the composite error in the variability calculated as the uncertainty volume is highlighted in green in (b).

