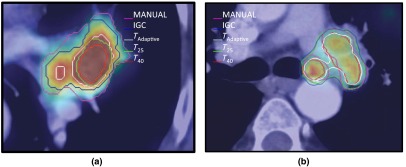
Fig. 5.
Representative examples showing differences in the IGC, , , and contours in comparison with the MANUAL contours. (a) Lesion (#10) where the MANUAL contour results in larger volumes than the automatic methods. (b) Lesion (#9) where the automatic methods result in larger volume compared with the MANUAL contour.

