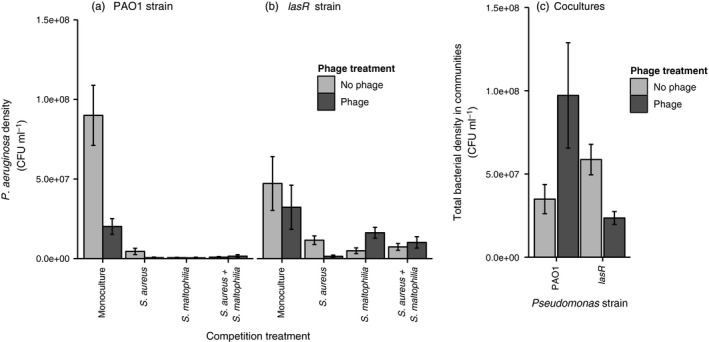
Figure 1.

The comparison of Pseudomonas aeruginosa (panels a and b) and total bacterial population densities (panel c) at the end of the selection experiment between different treatments (CFU denotes for colony‐forming units per ml). Panel c shows the mean over all competition treatments for PAO1 and lasR strains, respectively. All bars show ±1 SEM
