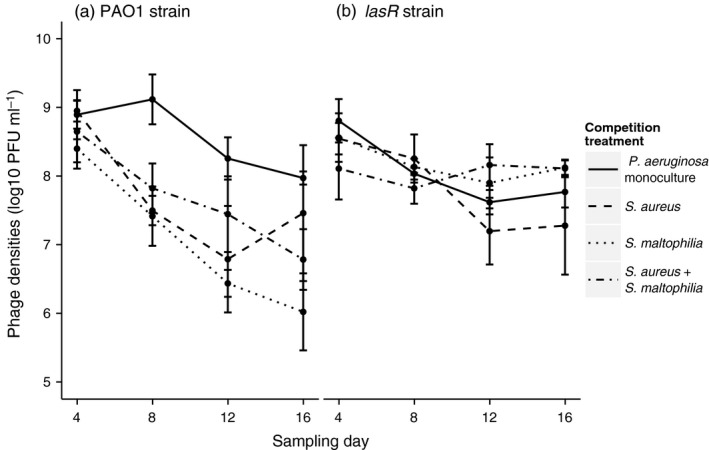
Figure 2.

Phage population densities in PAO1 (panel a) and lasR (panel b) focal pathogen communities in the absence and presence of competitors (PFU denotes for plaque‐forming units, that is phage particles per ml). All bars show ±1 SEM

Phage population densities in PAO1 (panel a) and lasR (panel b) focal pathogen communities in the absence and presence of competitors (PFU denotes for plaque‐forming units, that is phage particles per ml). All bars show ±1 SEM