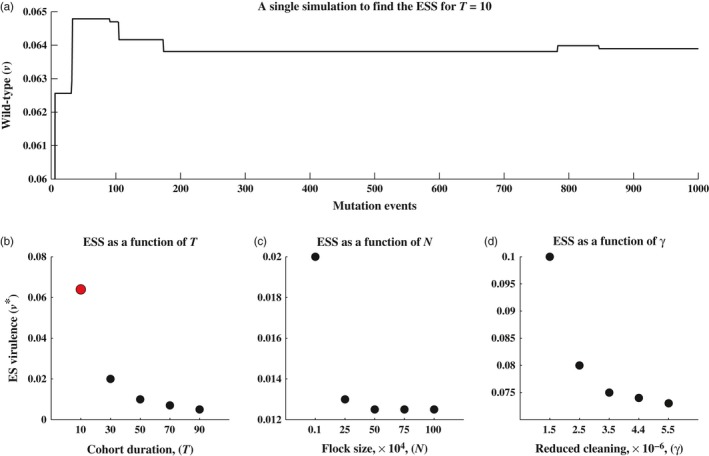
Figure 5.

Simulations for determining the evolutionary stable virulence level, v*, for varying levels of T, N and γ. In plot (a), we find the evolutionarily stable virulence level for T = 10. Using model (1), we sequentially introduce 1,000 unique randomly chosen mutants into the barn. The solid line is the current wild‐type strain of MD in the barn. The line jumps up or down when a mutant strain successfully invades and becomes the new wild‐type strain. After investigating the 1,000 random mutants, we have a good approximation for the ES virulence level, and we have produced the single red dot in plot (b). Each dot in figures (b–d) is found by performing a similar simulation to the one in plot (a), but for varying values of T, N and γ. All other parameters values are held at ω = 0.03, σ = 0.02, , δ = 0.5, γ = 0.15, N = 40,000 and T = 42, unless otherwise stated
