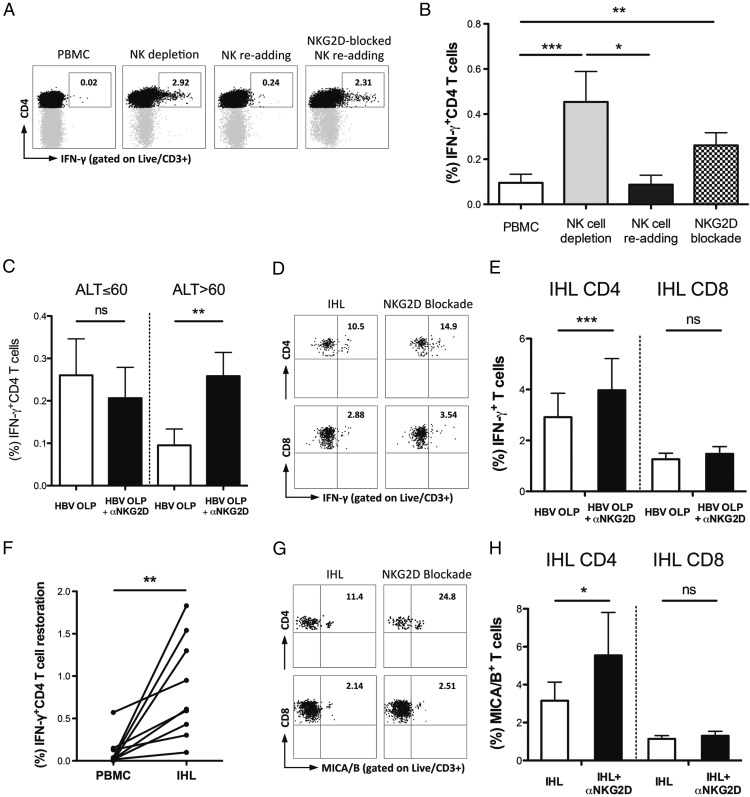
FIGURE 4.
Impact of NK cells and NKG2D blockade on HBV-specific and MICA/B-expressing T cells. Representative FACS plots (A) of HBV-specific (IFN-γ+) CD4 T cell changes upon NK cell depletion, NK cell readding +/− NKG2D blockade following short-term culture of PBMC from patients with CHB with HBV OLP. (B) Summary data of HBV-specific (IFN-γ+) CD4 T cell changes upon NK-depletion, NK cell readding and NKG2D blockade following short-term culture with HBV OLP in PBMC from patients with ALT >60 IU/l (n = 15), analyzed by Friedman test. (C) Comparison of HBV-specific (IFN-γ+) CD4 T cell restoration upon NKG2D blockade following short-term culture with HBV OLP of PBMC from patients with ALT ≤60 IU/l (n = 11) and patients with ALT >60 IU/l (n = 15), analyzed by Wilcoxon signed rank test. Representative FACS plots (D) and summary data (E) of intrahepatic HBV-specific (IFN-γ+) CD4 and CD8 T cell changes upon NKG2D blockade following overnight HBV OLP stimulation in IHL from patients with CHB (n = 12), analyzed by Wilcoxon signed rank test. (F) Comparison of HBV-specific (IFN-γ+) CD4 T cell restoration upon NKG2D blockade following overnight HBV OLP stimulation in paired PBMC and IHL from patients with CHB (n = 9), analyzed by Wilcoxon signed rank test. Representative FACS plots (G) and summary data (H) of intrahepatic MICA/B expressing CD4 and CD8 T cell changes upon NKG2D blockade following overnight HBV OLP stimulation in IHL from patients with CHB (n = 10), analyzed by Wilcoxon signed rank test. *p < 0.05, **p < 0.005, ***p < 0.001.

