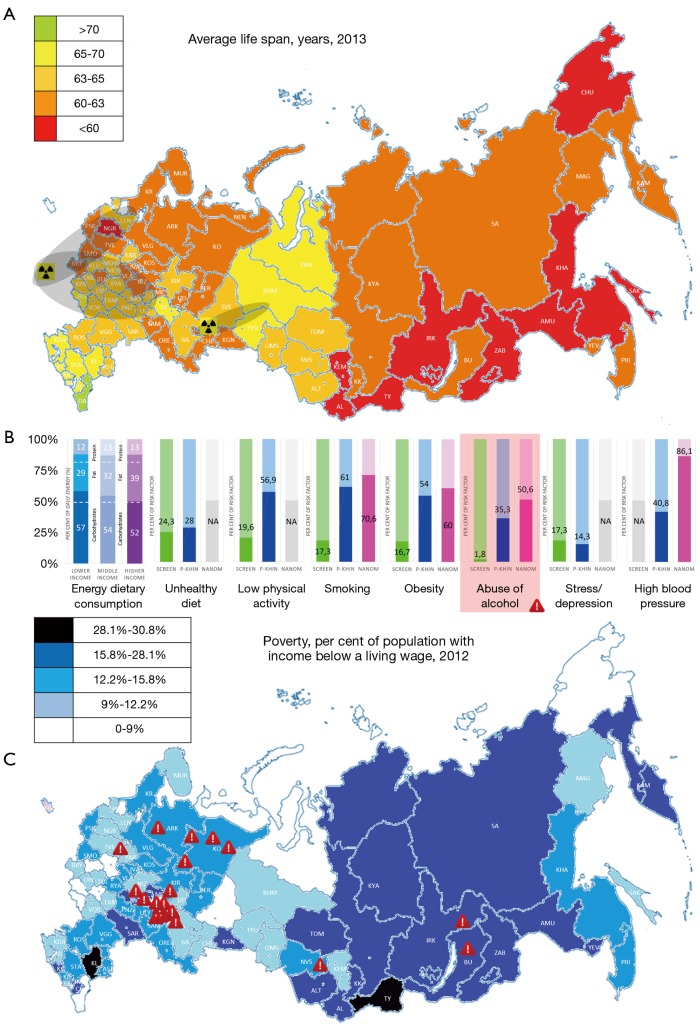
Figure 3.
Life span, poverty, and major national risk factors in Russia. The life expectancy you would see at the panel (A) becomes crucial when the reproduction is declined in few generations. The positive dynamics of the estimated life expectancy at birth since 2005 is comparable to the period of 1985–1988 when the anti-alcohol campaign was deployed, and the lifespan was the longest through the Russian history 70.1 years. According to the preliminary data of Rosstat, the life expectancy at birth in 2014 achieves 71.0 years (76.5 years for females and 65.3 years for males). The areas radioactively polluted in 1957 in Ozersk and in 1986 in Chernobyl specially marked with a grey color on the map. The panel (B) demonstrates macronutrient composition of the diet in Russian adults aged 19–55 years and revealed major national risk factors. Data for high cholesterol (86.7% of patients were revealed in NANOM-FIM trial) and diabetes (no such patients in NANOM-FIM trial) were not provided due to absence of the necessary information at the national screening database (14,15) and a dataset of Petrukhin et al. (5). The major factor presented in comparison of three databases of the National screening (screen) (14,15), Petrukhin et al. (P-khin) (5), and NANOM-FIM trial (NANOM) (18-20). The map (C) performs the situation with poverty in Russia which is not directly associated with CV mortality (R2 =0.1999, r=0.2574, P=0.02). The moderate but insignificant correlation (R2 =0.2646, r=0.5144, P>0.05) was confirmed between a level of poverty and RIA index of the socio-economic development in Russia which was higher than any associations with CV mortality. The highest consumption of vodka (red-marked) was revealed in the regions with high poverty and particularly in the rural suburb of Novosibirsk, a Koltsovo ‘science town’, with a 45.4 L of the absolute alcohol per capita a year, Smyshlyaevka and Petra Dubrava villages in Samara oblast with 41.4 L and 22.8 L respectively, Izyayu village in the Republic of Komi with 13.6 L, and the Republic of Tatarstan with an average 13.7 L per year (maximum of 20.4 L registered in Laishevo town). The lowest consumption of vodka documented in the Russian Caucasus with a mean 1.1 L of the absolute alcohol per person per year due to predominance of the ‘wine-and-brandy culture’ at this region.

