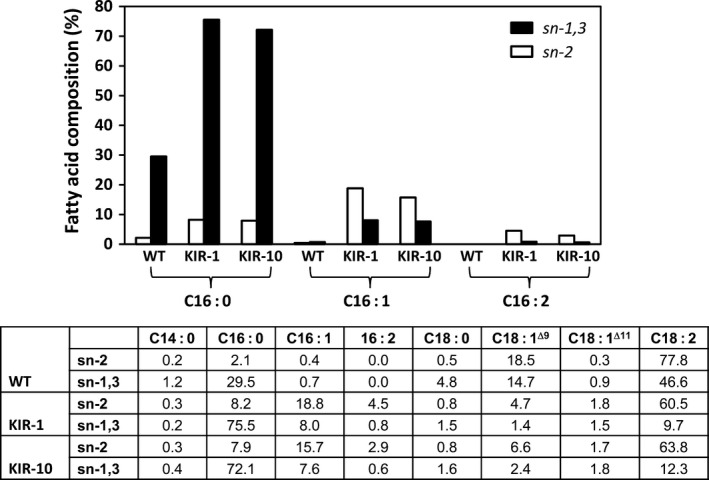
Figure 5.

sn Positional distribution of fatty acids in TAG fraction of cotton seed oil derived from HP cotton lines, KIR‐1 and KIR10, compared to the untransformed control Coker 315 (WT). sn‐1,3 (closed box); sn‐2 (open box). The full fatty acid composition of the specified sn position is tabulated below the bar diagram.
