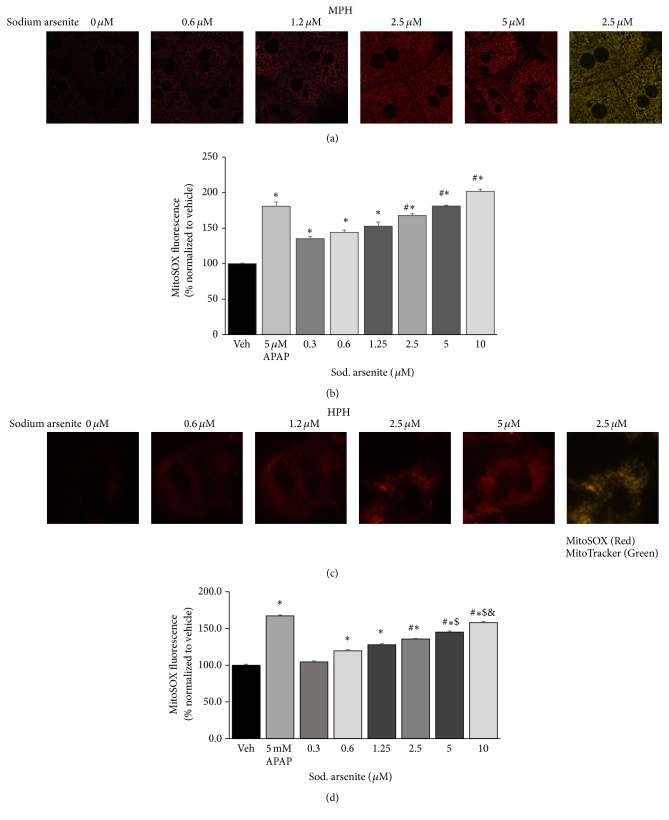
Figure 4.
Arsenite induced reactive oxygen radicals (ROS) in hepatocytes. ((a) and (c)) Live cell imaging of MitoSOX fluorescence and ((b) and (d)) spectrofluorometric analysis of mitochondrial reactive oxygen production (MitoSOX fluorescence) in lysates of ((a) and (b)) mouse and ((c) and (d)) human primary hepatocytes. Mitochondrial localization of MitoSOX was confirmed using MitoTracker (mitochondria). Overlay (yellow) represents colocalization of MitoSOX and MitoTracker. Results representative of three independent experiments. ∗Significantly different from vehicle control cells; P < 0.01. #Significantly different from 0.3 and 0.6 μM arsenite treated cells; P < 0.05. $Significantly different from 2.5 μM arsenite treated cells; P < 0.05. &Significantly different from 5 μM arsenite treated cells; P < 0.01. Values in (b) and (d) represent mean ± SD. APAP, acetaminophen.

