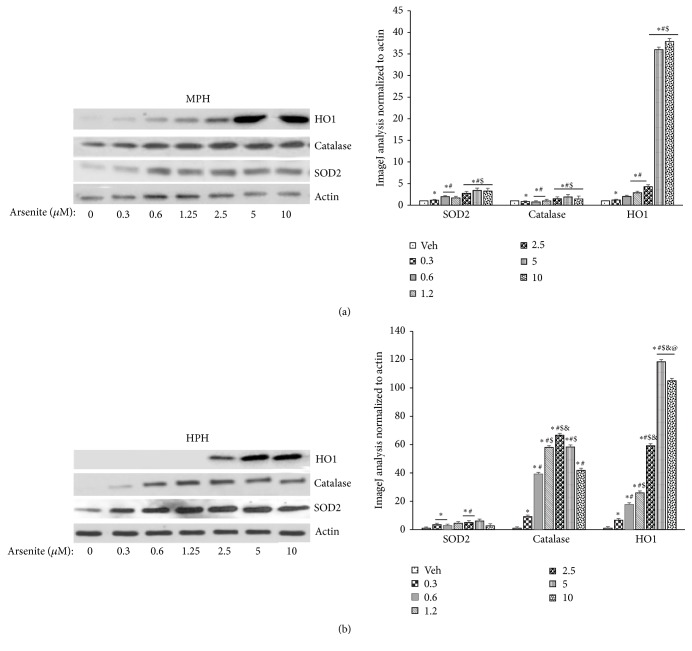
Figure 5.
Adaptive response to arsenite in primary hepatocytes. ((a) and (b)) Immunoblot analysis of heme oxygenase (HO1), catalase, and superoxide dismutase 2 (SOD2) expression in (a) mouse and (b) human primary hepatocytes. Histograms to the right of (a) and (b) show ImageJ analysis of the immunoblot data presented in (a) and (b), respectively. Results representative of three independent experiments. ImageJ analysis data are normalized to actin and presented as mean ± SD. ∗Significantly different from vehicle treated cells; P < 0.01. #Significantly different from 0.3 uM arsenite treated cells; P < 0.01. $Significantly different from 0.6 and 1.2 uM arsenite treated cells in panel (a); P < 0.01. &Significantly different from 1.2 uM arsenite treated cells in panel (b); P < 0.01. @Significantly different from 10 uM arsenite treated cell in panel (b); P < 0.01.

