
Figure 1.
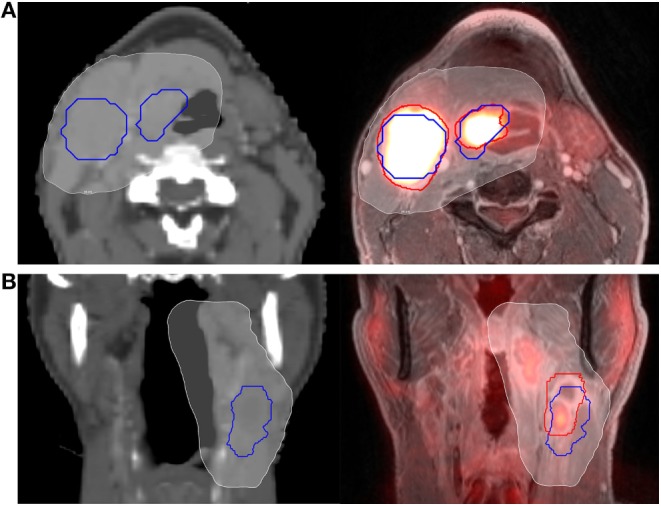
Example of computed tomography (CT) vs. PET/MRI GTV delineation. Primary tumor and nodal GTVs for two different patients (A,B) are shown delineated using CT (blue outline) and PET/MRI (red outline). The 95% prescription isodose line from their CT-based treatment plan is overlayed (white, shaded). The patient in panel (A) (axial representation) had fair spatial overlap between PET/MRI and CT volumes, with a Dice similarity coefficient (DSC) of 0.72 for the primary GTV and 0.69 for the nodal GTV. The patient in panel (B) (coronal representation) had relatively poor spatial overlap between the PET/MRI and CT nodal volumes, with a DSC of only 0.48. Clinical target volume and planning target volume expansions are not shown.