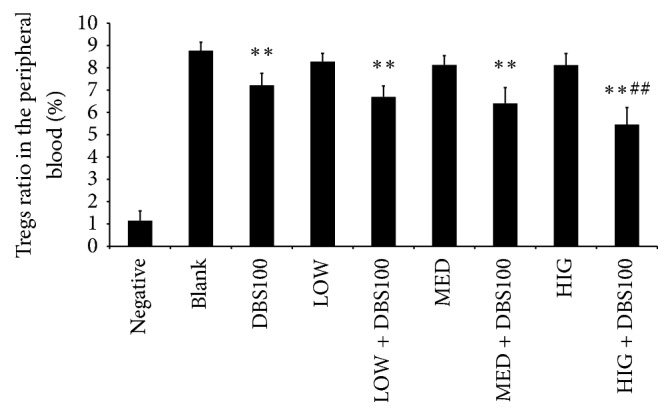
Figure 9.

Ratio of CD4+CD25+CD127dim/CD4+ (Tregs) in mice. ∗∗ P < 0.01, compared with the blank group. ## P < 0.01, compared with the Citrobacter freundii DBS100 treated alone group.

Ratio of CD4+CD25+CD127dim/CD4+ (Tregs) in mice. ∗∗ P < 0.01, compared with the blank group. ## P < 0.01, compared with the Citrobacter freundii DBS100 treated alone group.