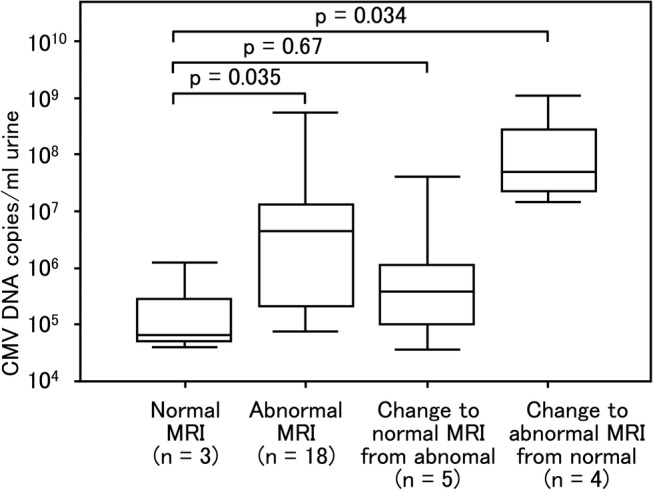
Figure 7.

Comparison of cytomegalovirus (CMV) load in urine samples of newborns with congenital CMV infection with respect to the changes in MRI findings. Urine samples were collected from newborns within 0–5 days of birth. The first MRI scans were performed at less than 5 months of age. The second MRI scans were performed between the age of 16 months and 20 months. One of 31 newborns who underwent the first and second MRI scans was excluded from the comparison because the first MRI scan was performed at 10 months of age. In the first and second MRI scans, three newborns (normal) showed no abnormalities while 18 newborns (abnormal) showed central nervous system damage. The initial scan revealed abnormalities but the second scan showed no abnormalities in five newborns (changed to normal). In contrast, the initial scan revealed no abnormalities but the second scan showed abnormalities in four newborns (change to abnormal). The 18 (abnormal MRI) and four newborns (change to abnormal MRI from normal) who had abnormalities in the second MRI scans showed a significant difference (p=0.035 and p=0.034, respectively) compared with three newborns (normal) who had no abnormalities in both the first and second MRI scans while the five newborns who had no abnormalities in the second MRI scans showed no significant difference (p=0.67) compared with newborns with no abnormalities in both the first and second MRI scans. Upper and lower borders of box plots represent the 25th and 75th percentiles and bars represent median viral loads. Upper and lower bars indicate maximum and minimum viral load, respectively.
