Figure 10.
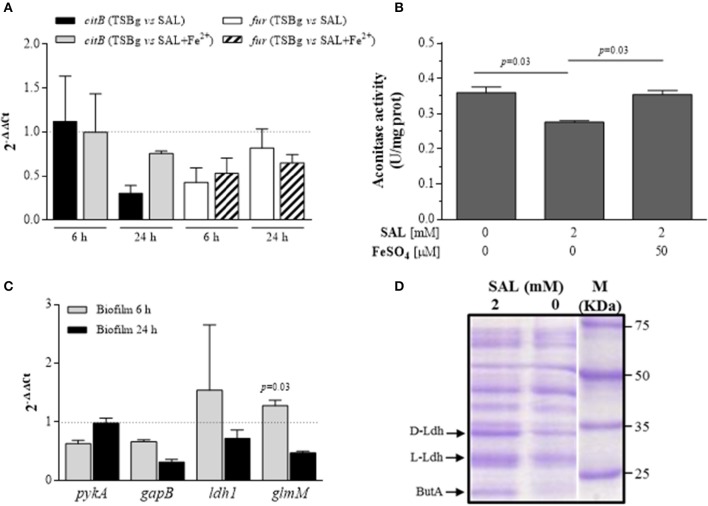
Metabolic status of S. aureus biofilms treated with SAL. (A) Expression of citB and fur transcripts from immature (6 h) and mature (24 h) biofilms formed by the Newman strain in the presence of 2 mM of SAL or SAL plus 50 μM of FeSO4. Changes in gene expression are shown as normalized mean fold change [2(−ΔΔCt)] ± SEM (differences of target gene expression with SAL or SAL+Fe2+ compared with target gene expression in TSBg). Data were normalized to gyrB expression. Untreated biofilms (TSBg groups) were used as controls (controls = 1, represented by a dotted horizontal line). 2(−ΔΔCt) >1 represents significant increased expression and 2(−ΔΔCt) < 1 indicates significant decreased expression. Each bar represents the arithmetic mean of duplicate measurements from 3 independent experiments. (B) Aconitase activity quantification in biofilms produced by Newman strain grown during 24 h in TSBg supplemented with SAL or FeSO4 as indicated. The amount of aconitase produced was related to mg of total proteins. Each bar represents the arithmetic mean ± SEM of 3 independent experiments in triplicate. (C) Expression of pykA, gapB, ldh1, and glmM transcripts from Newman biofilms grown during 6 or 24 h in the presence of 2 mM of SAL or SAL plus 50 μM of FeSO4. Changes in gene expression are shown as normalized mean fold change [2(−ΔΔCt)] ± SEM (differences of target gene expression with SAL or SAL+Fe2+ compared with target gene expression in TSBg). Data were normalized to gyrB expression. Untreated biofilms (TSBg groups) were used as controls (controls = 1, represented by a dotted horizontal line). (D) Cell wall cellular protein profiles assessed by SDS-PAGE. Bands represent proteins extracted from Newman biofilms cultured during 24 h in TSBg supplemented with SAL or FeSO4 as indicated. Abbreviations are: D- and L-Ldh (D- and L-lactate dehidrogenase, respectively) and ButA (acetoin reductase). Equivalent volumes of cell extracts were loaded into each lane. Arrows indicate the polypeptides confirmed in each fraction by MS/MS (MALDI-TOF).

