Figure 12.
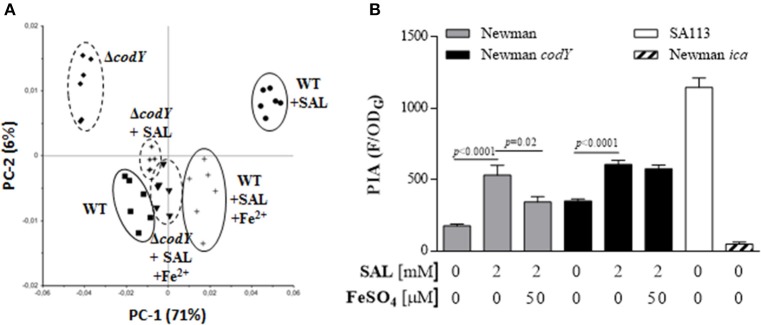
Interplay of codY and SAL in biofilms. (A) The surface glycopolymer composition was examined by FTIR spectroscopy. PCA was carried out on second derivative, vector-normalized FTIR spectra in the spectral range of 1200–800 cm−1 derived from biofilm produced by the strain Newman and its isogenic codY mutant. Bacteria were grown in TSBg in the presence or absence of 2 mM of SAL with or without 50 μM of FeSO4. Clusters are indicated with ellipses. Symbols are defined in the figure. The relative contribution of each PC is indicated in parentheses. (B) PIA production by the Newman codY mutant in biofilms was assessed by fluorometric assays. Each bar represents the arithmetic mean ± SEM of quadruplicate measurements from 3 independent experiments. The values of fluorescence (F) were related to the OD of growth (ODG) in each well. Comparisons are represented by lines and p-values are denoted above. Data from the SA113 and Newman ica-deficient mutants were included as positive and negative controls, respectively.

