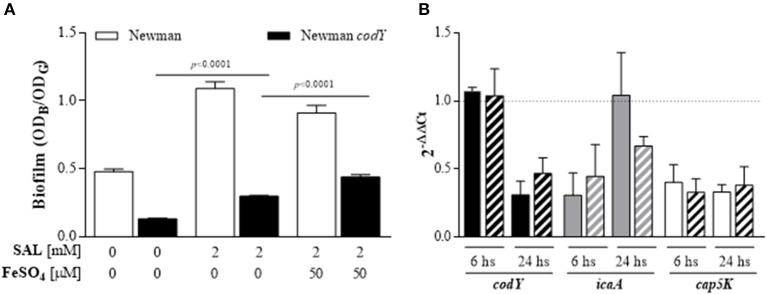
Figure 13.
SAL decreases the codY transcript level and CodY contributes to diminishing SAL-induced biofilm after iron addition. (A) Biofilms formed by the Newman strain and its isogenic codY mutant in TSBg during 24 h in the presence or absence of 2 mM of SAL with or without 50 μM of FeSO4. Each bar represents the arithmetic mean ± SEM of sixtuplicate measurement from 3 independent experiments. The biofilms were quantified by crystal violet staining (ODB) and expressed relative to the final culture density (ODG). Comparisons are represented by lines and p-values are indicated above. (B) Expression of codY, icaA, and cap5K transcripts from immature (6 h) and mature (24 h) biofilms formed by the Newman strain grown in the presence or absence of 2 mM of SAL with or without addition of 50 μM of FeSO4. Changes in gene expression are shown as normalized mean fold change [2(−ΔΔCt)] ± SEM (differences of target gene expression with SAL or SAL+Fe2+ compared to target gene expression in TSBg). Data were normalized to gyrB expression. Untreated biofilms (TSBg groups) were used as controls (controls = 1, represented by dotted horizontal line). Plain bars: TSBg vs. SAL. Striped bars: TSBg vs. SAL+Fe2+. Each bar represents the arithmetic mean ± SEM of 3 independent experiments in duplicate.

