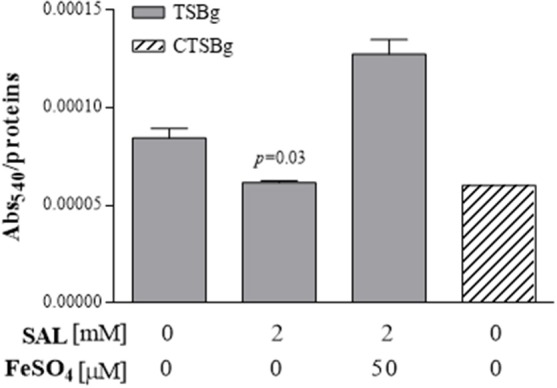
Figure 2.

Intracellular ferrous ion contents after SAL treatment of S. aureus biofilms. Each bar represents the arithmetic mean ± SEM of Abs540 related to μg/ml of protein/well of samples measured in triplicate from 3 independent experiments. Comparison of SAL-treated vs. untreated groups was significantly different (p = 0.03) (Mann-Whitney test). CTSBg (TSBg treated with Chelex-100) was utilized as reference value.
