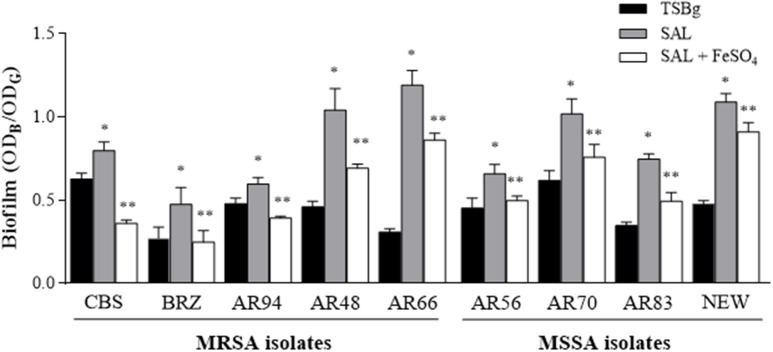
Figure 4.
The effect of SAL on biofilm formed by MRSA and MSSA strains. Biofilms were formed in TSBg during 24 h in the presence or absence of 2 mM of SAL or SAL plus 50 μM of FeSO4. Each bar represents the arithmetic mean ± SEM of 6 wells from 4 independent experiments. The biofilms were quantified by crystal violet staining (ODB) and expressed relative to the final culture density (ODG). Statistically significant differences were represented by asterisks: (*) SAL-treated group vs. untreated group; (**) SAL-treated group vs. SAL plus iron-treated group. p < 0.05 were considered significant (Mann-Whitney test).

