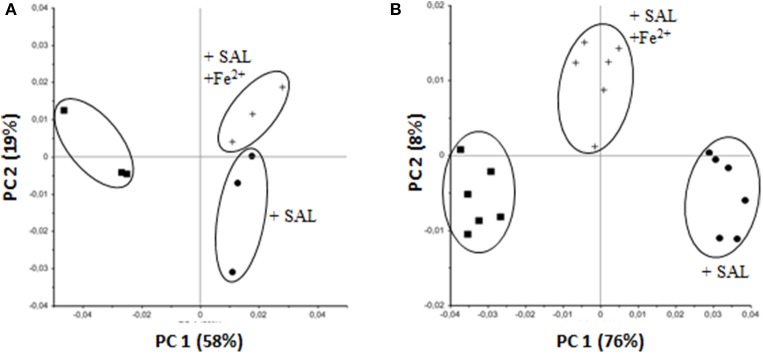
Figure 6.
Impact of SAL and SAL plus iron on S. aureus monitored by FTIR spectroscopy. PCA was carried out on second derivative, vector-normalized FTIR spectra in the spectral range for glycopolymers (1200–800 cm−1). (A) Newman strain, planktonic culture. (B) Biofilm formed by the Newman strain. In both cases bacteria were grown in TSBg with or without 2 mM of SAL or SAL plus 50 μM FeSO4. Clusters are indicated with ellipses. Symbols are defined in the figure. The relative contribution of each principal component is indicated in parentheses.

