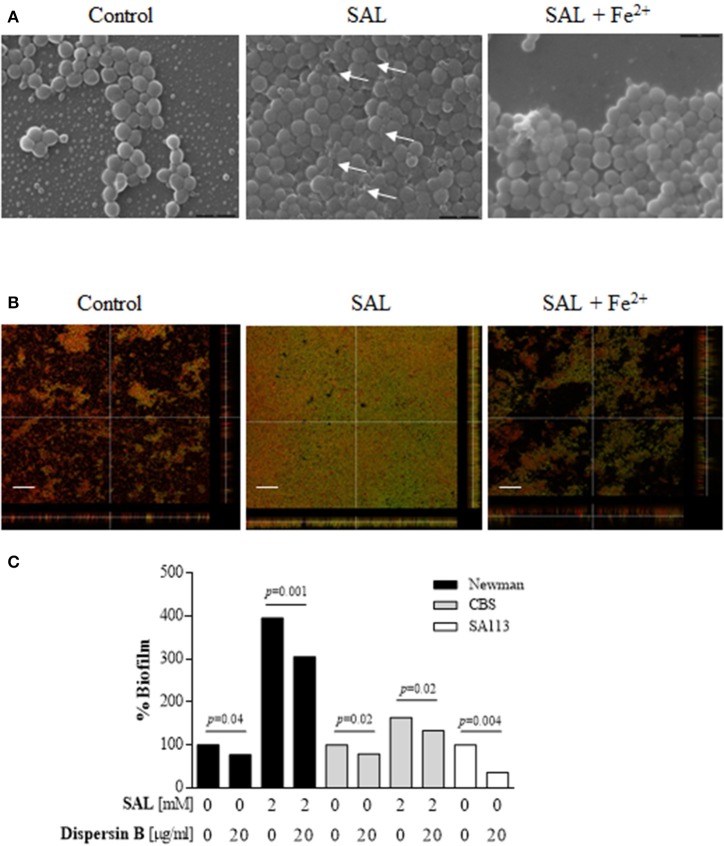
Figure 8.
Assessment of extracellular polysaccharide matrix in the Newman strain biofilms. (A) Scanning electron microscopy (SEM) of Newman biofilms grown statically for 24 h at 37°C in TSBg supplemented with 2 mM of SAL or 50 μM of FeSO4 as indicated. The magnification is 10,000 ×. Arrows show extracellular substances between adjacent cells. (B) Visualization of the extracellular polysaccharide matrix in Newman biofilms by CLSM after staining with green fluorescent labeled WGA. Bacterial cells were stained with the lipophilic membrane red dye FM 4-64. Sagittal sections of the biofilms are shown below and to the right of each panel. Scale bar: 10 μm. Results are representative of two experiments. (C) The effect of Dispersin B treatment on the detachment of the Newman biofilms. Each bar represents the percentage of biofilm formed after the treatments. Lines indicate statistically significant decrease of biofilm formation by cells attached following Dispersin B treatment compared with the untreated biofilms.

