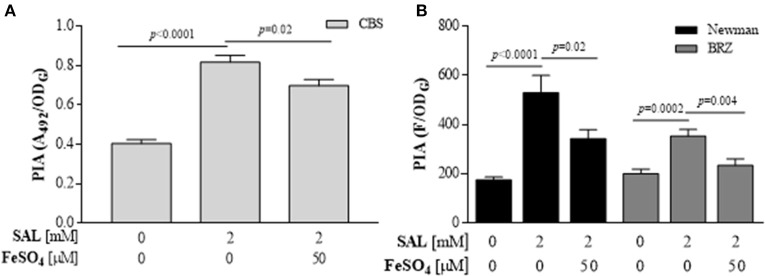
Figure 9.
Quantification of PIA produced in SAL-induced S. aureus biofilms. (A) PIA produced by CBS strain assessed by ELISA assay. (B) PIA expresses by BRZ and Newman strains assessed by the fluorometric assay. Each bar represents the mean ± SEM of quadruplicate measurements of from 3 independent experiments. The values of Abs492 or fluorescence (F) were relative to the final density of culture (ODG). Comparisons are represented by lines and each p-value is denoted above.

