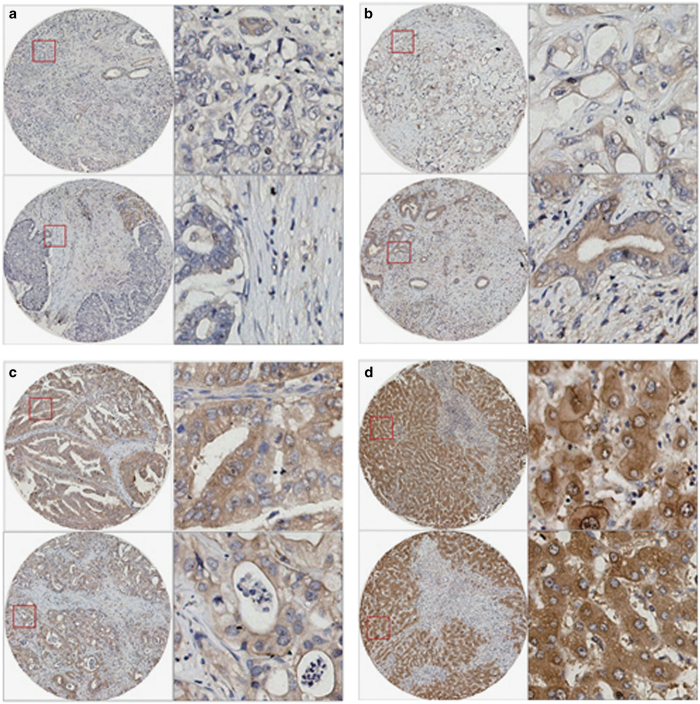
Figure 6.
RIP3 was expressed in most CCA tissues. (a–d) Representative images of IHC using RIP3 antibody in CCA tissues (a–c) and the paired normal liver tissues (d). The left images were shown at ×100 magnification, and the right were corresponding to the left in the red box at ×400 magnification. Yellow represented RIP3, and blue were on behalf of the nucleus. (a) Representative images of negative RIP3 expression in CCA tissues (−). (b) Representative images of low RIP3 expression in CCA tissues (+). (c) Representative images of strong RIP3 expression in CCA tissues (++). (d) Representative images of strong RIP3 expression in CCA-adjacent normal liver tissues (++).

