Figure 2.
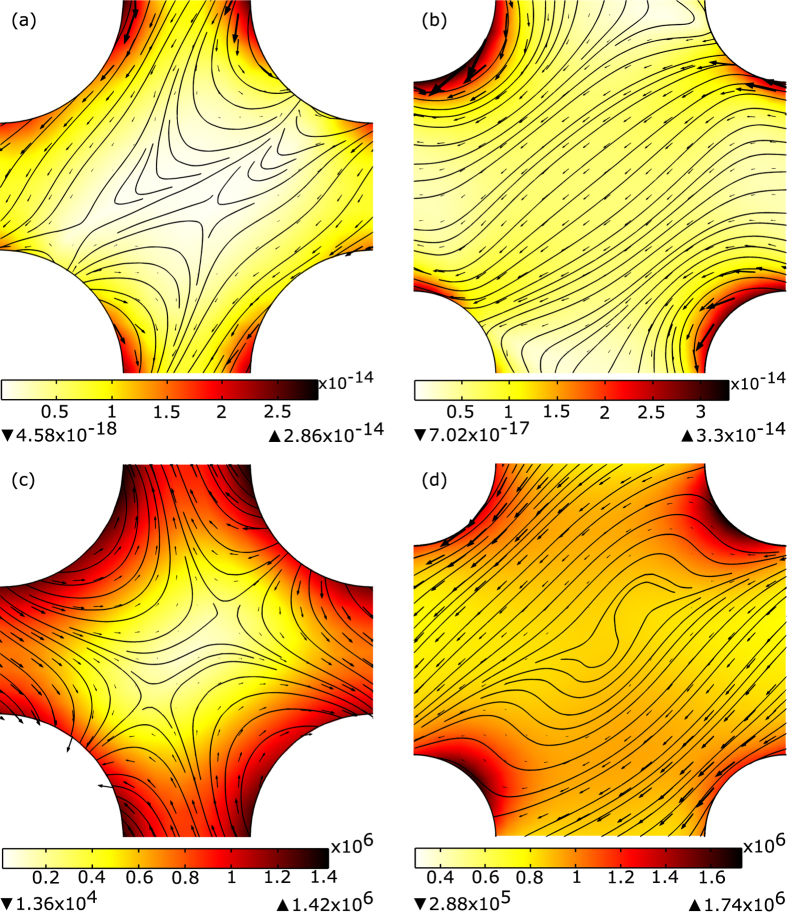
One unit cell of the left-handed PhC with square lattice and parameters taken from ref. 20 (a and c), and ref. 21 (b and d) - see Table 1. Figures (c and d) show the plot of the electric field amplitude (color map) and power flow (arrows), while Figures (a and b) show the optical force magnitude (color map), direction (arrows), and possible trajectories (lines) for the probe particle. The interior of the rods is not shown.

