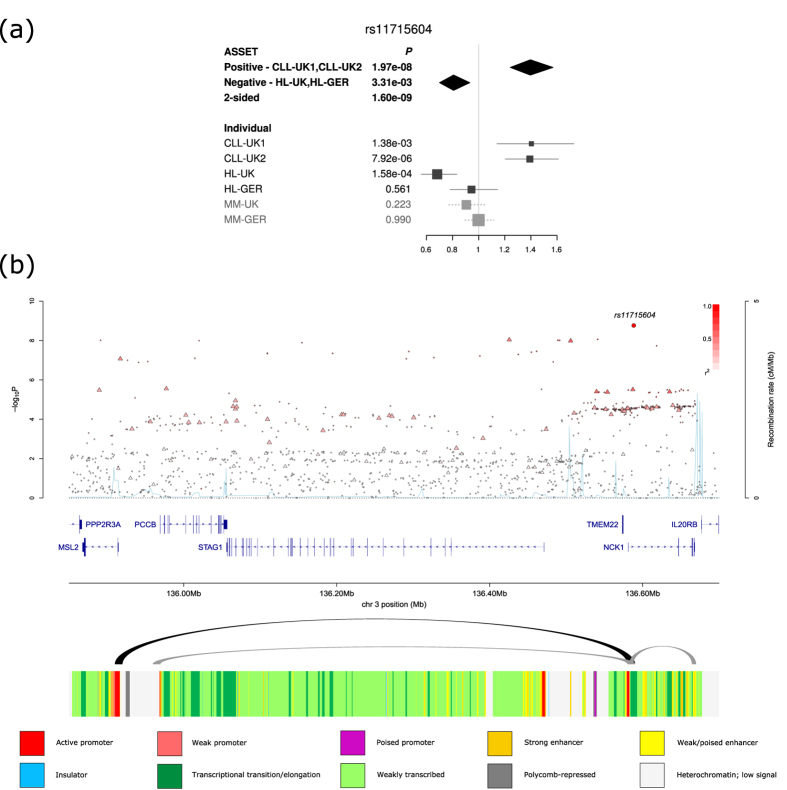
Figure 2.
(a) Forest plot of the ORs for the association between rs11715604 and BCM. Studies were weighted according to the inverse of the variance of the log of the OR calculated. Horizontal lines: 95% CI. Box: OR point estimate; box area is proportional to the weight of the study. Diamond: overall summary estimate, with CI given by its width. Unbroken vertical line: null value (OR = 1.0). (b) Regional plot of association and recombination rates. −log10(P) (y axis) of the SNPs are shown according to their chromosomal positions (x axis). The sentinel SNP is shown as a large circle. The colour intensity of each symbol reflects the extent of LD with the sentinel SNP: white (r2 = 0) through to dark red (r2 = 1.0). Genetic recombination rates, estimated from the 1000 Genomes Project, are shown with a light blue line. Physical positions are based on NCBI build 37 of the human genome. Also shown are the relative positions of genes and transcripts mapping to the region of association. The arcs represent Hi-C promoter contacts in GM12878 cells. The colour intensity of each contact reflects the interaction score. The bottom track represents the chromatin-state segmentation track (ChromHMM) for lymphoblastoid cells using data from the HapMap ENCODE Project.

