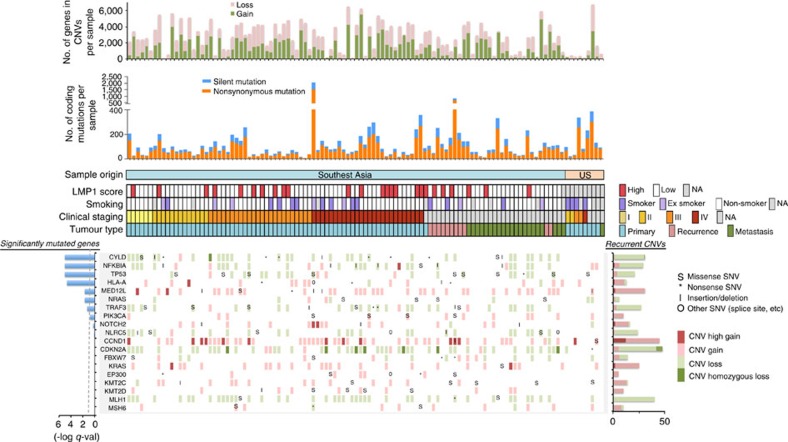
Figure 2. The genomic landscape of NPC.
For each patient (each column), recurrently altered genes (rows) with mutations and CNVs are shown. Significantly mutated genes (identified using the MutSigCV 2.0 algorithm; q<0.1, left panel) are ordered by q value, with additional genes near significance are also shown. Recurrent gene copy changes across the patients are summarized on the right panel. For each patient, the number of mutations and CNVs are shown on the top panels, as well as the sample origin, latent-membrane protein 1 (LMP1) expression, smoking status, clinical staging and tumour type.

