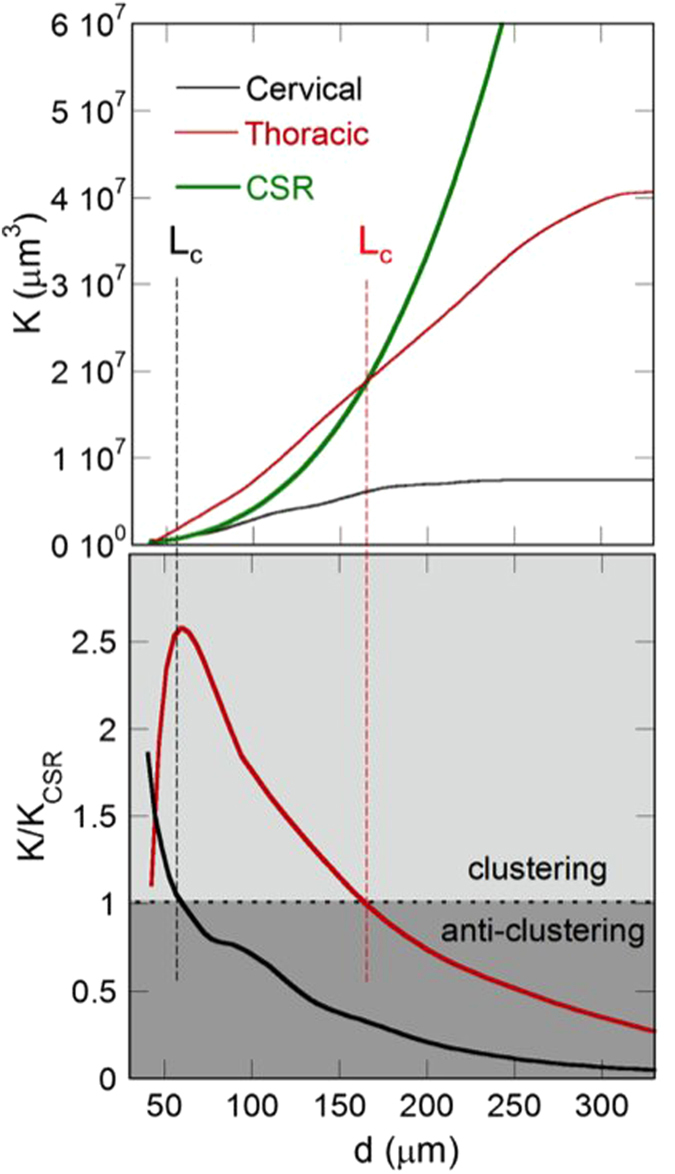
Figure 6. (Upper panel) K-Ripley function of the motor neurons calculated in a typical volume of (red line) thoracic and (black line) cervical region.

The thick green lines represent the K-Ripley function of randomly located neurons. (Lower panel) K/KCSR ratio, of the motor neurons calculated in the same volume in (red line) thoracic and (black line) cervical region. In the dark regions (ρ > 1) the neurons tend to clusterize on distances, Lc, indicated by the dashed lines at 165 μm and 55 μm in the thoracic and cervical regions, respectively.
