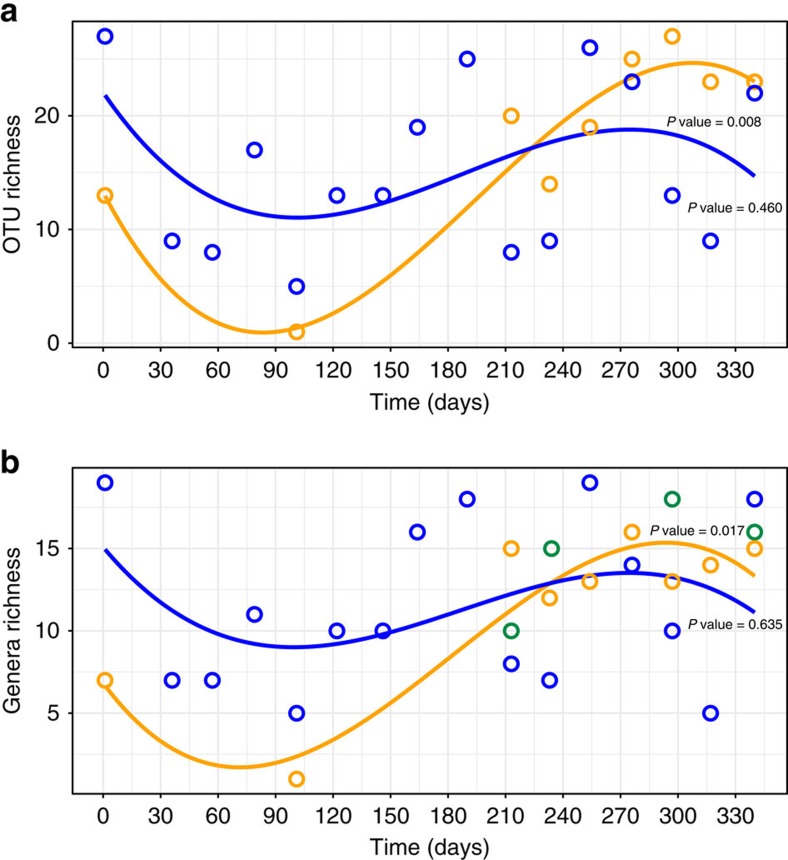
Figure 3. Richness patterns for Chironomidae OTUs and genera.
(a) OTU richness. (b) Genera richness. Points represent richness values to individual sampling points for eDNA (blue), community DNA (orange) and taxonomic identification of chironomid exuviae (green). Sampling points spanning the winter months (days 36–190) did not yield data due to very low physical numbers of exuviae. Best fitted, significant lines from polynomial regressions for eDNA samples (blue) and community DNA (orange), plotted against time (x axis: September 2013 to September 2014) (a) eDNA: P value=0.46, community DNA: P value=0.008 (N=25 datapoints), (b) eDNA: P value=0.017, community DNA P value=0.635 (N=29 datapoints).

