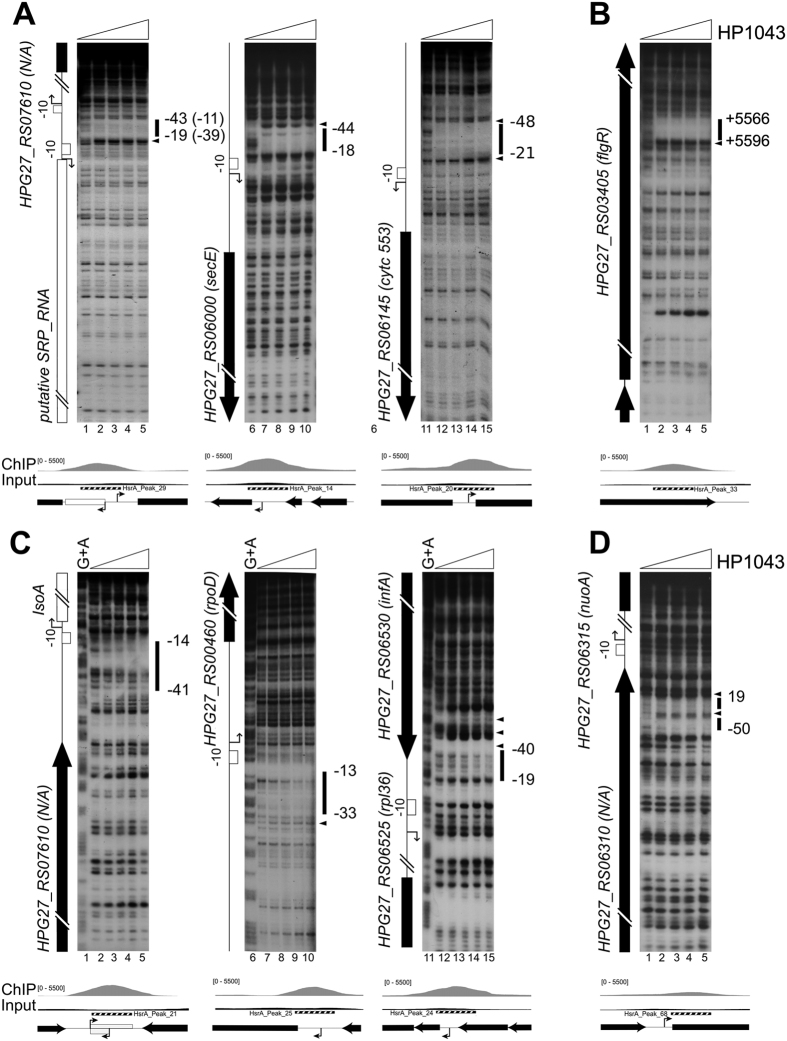
Figure 3. In vitro binding of purified recombinant HP1043 protein on selected genomic regions identified by ChIP-seq.
In panel A high affinity promoter binding sites are shown, in panel B footprinting validation of an intragenic binding site is reported, in panel C low affinity promoter binding sites are represented and in panel D footprint validation of a binding site not included in the top scoring peak list. Radiolabelled DNA probes, harbouring the genomic regions of interest, were incubated with increasing concentrations of purified HP1043 (0, 1.7, 3.3, 6.6, 13.3 μM of dimeric HP1043 from left to right in each experiment) and subjected to DNase I digestion. Purified DNA fragments were separated on a polyacrylamide denaturing gel along with a G + A sequence reaction ladder (Panel C and data not shown) to map the binding sites. On the left of each autoradiograph, a schematic representation of the genomic region is drawn, with block arrows depicting coding sequences (black arrows or blocks) or putative sRNA (white arrow). Bent arrows represent the transcriptional start sites identified in H. pylori strain G27 by primer extension analyses (Supplementary Fig. 3S), white boxes the −10 promoter sequence. Notably, the initiation of RNA transcription at the analysed promoters is conserved between strain G27 and 26695. Black vertical lines on the right of each autoradiograph represent regions of protection from DNase I digestion, while black arrowheads highlight DNase I hyper-sensitive sites. Numbers refer to the positions with respect to the transcription start site (or with respect to the ATG translational start codon for the internal binding site on HPG27_RS03405). For the binding site mapped in the intergenic region between HPG27_RS00110 and putative SRP_RNA genes, HP1043 binding positions are reported with respect to the transcriptional start site of both genes (with no brackets for putative SRP_RNA, with brackets for HPG27_RS00110). Below each autoradiograph, a magnification of base-count data, deriving from ChIP-seq (as in Fig. 2A) of the genomic regions of interest, is reported together with a schematic representation of genes and features of the locus.

